2020 Apple Crop Projected Slightly Down From Last Year
From
| 28 August 2020

Overview of the US apple season, complemented by charts from Agronometrics. Original published on August 21, 2020.
The U.S. Apple Association agrees with USDA’s Aug. 12 estimate of 253.6 million bushels – down 3% from the 2019 crop and 2% from the five-year average – which would be the ninth-largest crop since the government department began reporting apple production in the 1940s.
USApple made the determination this week at the organization’s 125th Annual Crop and Outlook Marketing Conference, which was held on-line, attracting about 120 attendees.
Looking at a regional breakdown, the East apple crop is expected to be off by 8% from last year and down 9% from the five-year average. In the Midwest, the crop is forecast is on par with last year, down 9% from the five-year average. And in the West, the crop is expected down 3% but up 5% on the five-year average.
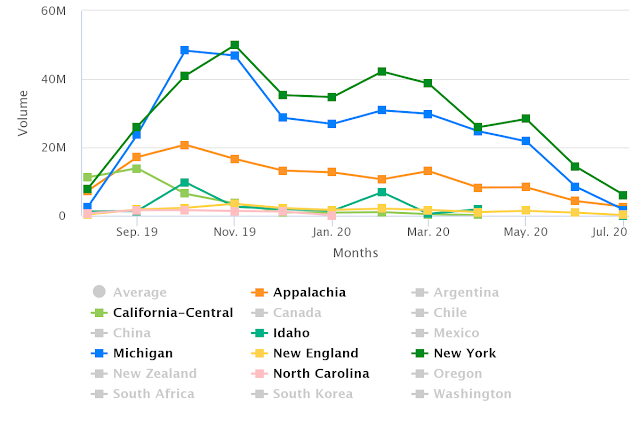
Volumes (in LB) of Apples from the US in the US Market, excluding Washington

Source: USDA Market News via Agronometrics.
(Agronometrics users can view this chart with live updates here)
Growers attending the meeting from Washington State, which dominates production with close to 2/3 of the nation’s crop, were quick to add that the estimates are for the amount of fruit on the trees. Washington marketers say the amount that will actually be sold on the fresh market this coming year will definitely be lower than last year.
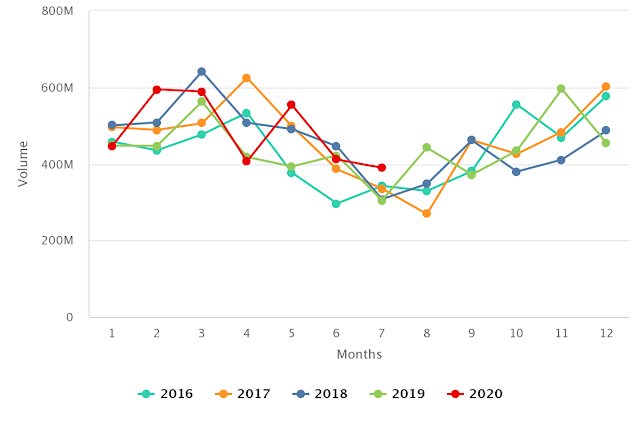
Volumes (in LB) of Apples from Washington in the US market

Source: USDA Market News via Agronometrics.
(Agronometrics users can view this chart with live updates here)
By variety, the top five produced cultivars are: 1) ‘Gala’ 2) ‘Red Delicious’ 3) ‘Honeycrisp’ 4) ‘Granny Smith’ and 5) ‘Fuji’.
The top three varieties – ‘Gala’, ‘Red Delicious’, and ‘Honeycrisp’ – comprise 48% of all production. The top five varieties (adding ‘Granny Smith’ and ‘Fuji’) comprise 67%.
The News in Charts is a collection of stories from the industry complemented by charts from Agronometrics to help better tell their story.
Access the original article with this (Link)
Related Stories