
Agronometrics in Charts: California grape growers grapple with uncertainties
By
| 3 May 2022

In this installment of the ‘Agronometrics In Charts’ series, Sarah Ilyas evaluates the state of the California grape market. Each week the series looks at a different horticultural commodity, focusing on a specific origin or topic visualizing the market factors that are driving change.
Over 99 percent of grapes commercially grown in the United States today come from California. With 82 varieties grown, California grapes come in three colors and are available May through January. According to the USDA California Grape Acreage Report, California’s 2021 grape acreage totaled 881,000 acres. Of the total grape acreage, 829,000 were bearing while 52,000 were non-bearing. Table-type grape acreage totaled 128,000 acres with 118,000 bearing and 10,000 non-bearing. Flame Seedless was the leading table-type grape variety. Thompson Seedless continued to be the leading raisin-type variety and was utilized for raisins, fresh market, concentrate, and wine. As for pricing, white seedless variety saw prices at $26.77 per kg, Black seedless at $18.23 pe kg and Red seedless at $15.95 per kg.
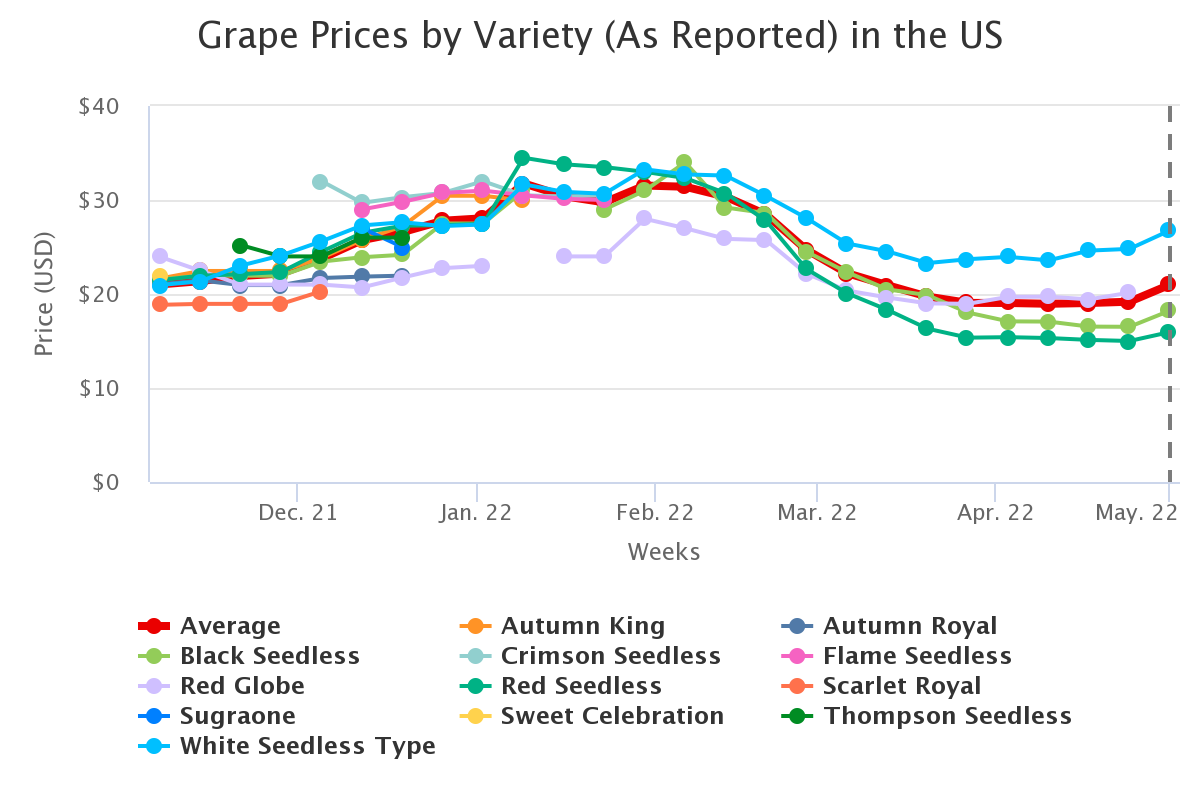
Source: USDA Market News via Agronometrics.
(Agronometrics users can view this chart with live updates here)
Pricing for table grapes from California was on average, higher compared to 2021 ,2019 and 2018. Pricing for the upcoming season will be directly dependent on the produced volumes, with lower volumes implying heftier prices.
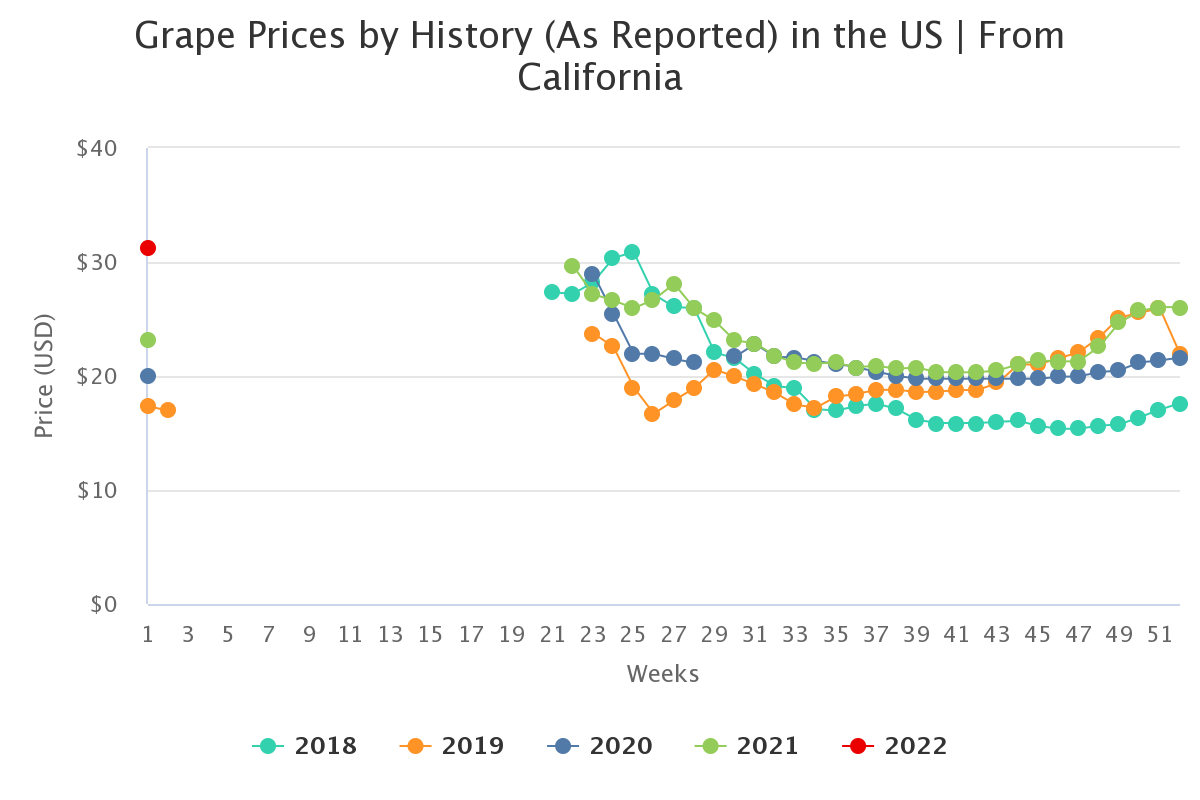
Source: USDA Market News via Agronometrics.
(Agronometrics users can view this chart with live updates here)
Week 24 of 2021 saw a total of 2.5 K tonnes of grapes from Southern California. Volume from Central California in 2021 stood at a total of 39 K tonnes in week 40.
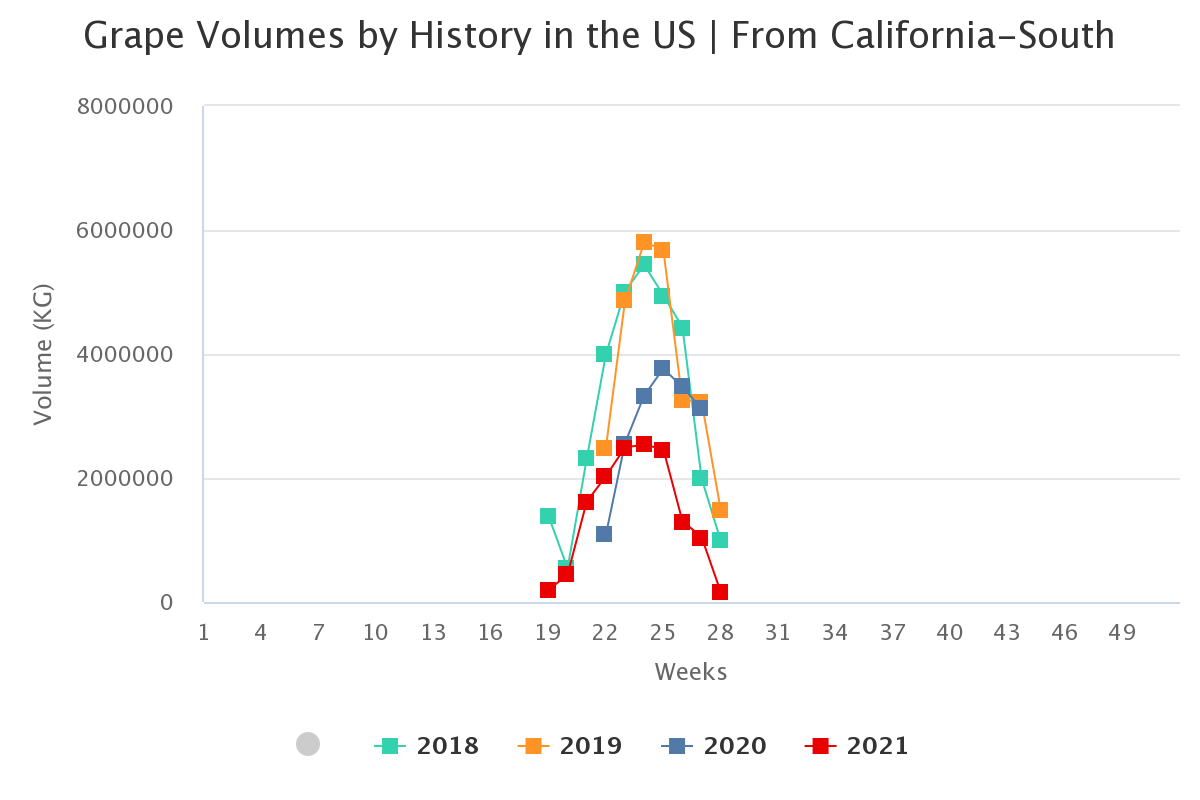
Source: USDA Market News via Agronometrics.
(Agronometrics users can view this chart with live updates here)
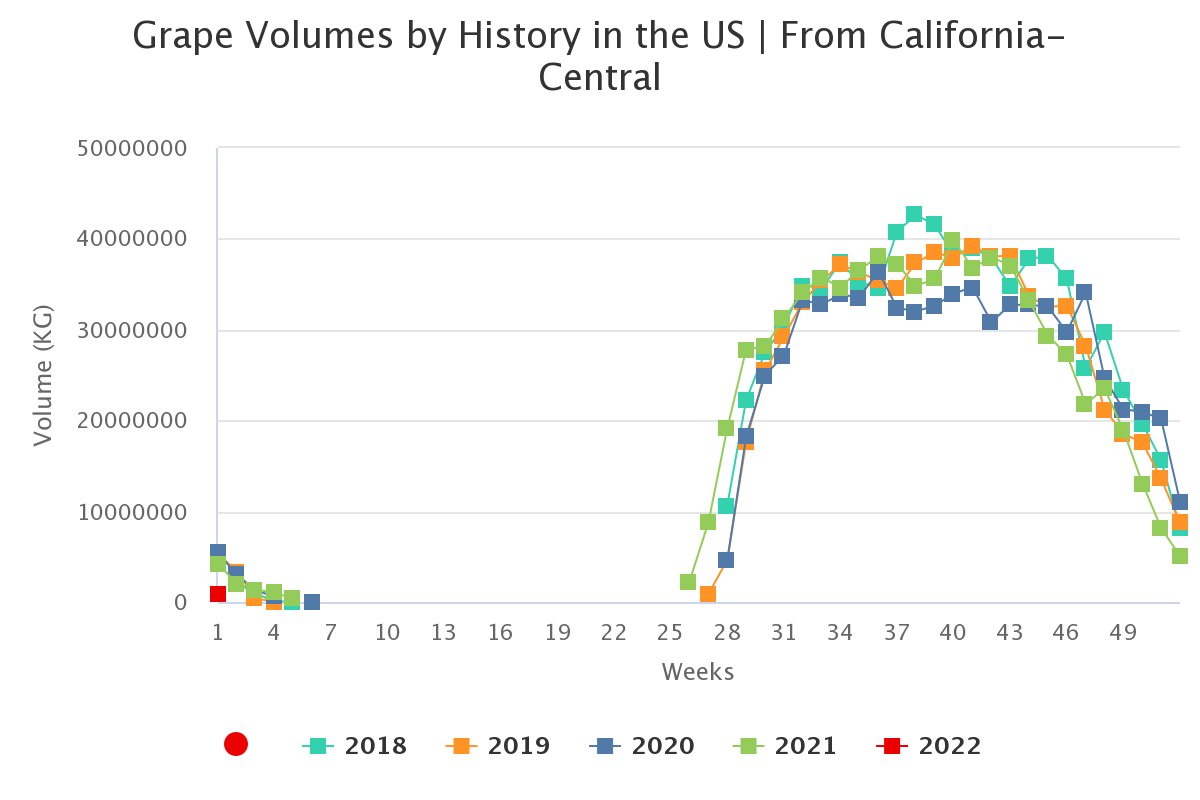
Source: USDA Market News via Agronometrics.
(Agronometrics users can view this chart with live updates here)
The USDA recently announced its commitment of $30 million to purchase U.S.-grown table grapes in 2022 for distribution to food banks and other food programs around the country. Purchases will be made June through December. “Water will be a big issue in the valley and other places that rely on contracted supply with curtailments forthcoming; labor is a major issue, especially during pruning and thinning and while the mechanical part of that component is coming on, it’s not coming fast enough. We really wish the state would move forward with things like autonomous tractors,” says Tom Slater of Clarksburg. Speaking about his predictions for the 2022 season, Slater said, “It’s one cold spell away from being anywhere near accurate.”
In our ‘In Charts’ series, we work to tell some of the stories that are moving the industry. Feel free to take a look at the other articles by clicking here.
All pricing for domestic US produce represents the spot market at Shipping Point (i.e. packing house/climate controlled warehouse, etc.). For imported fruit, the pricing data represents the spot market at Port of Entry.
You can keep track of the markets daily through Agronometrics, a data visualization tool built to help the industry make sense of the huge amounts of data that professionals need to access to make informed decisions. If you found the information and the charts from this article useful, feel free to visit us at www.agronometrics.com where you can easily access these same graphs, or explore the other 21 commodities we currently track.
Written by: Sarah Ilyas


