
Agronometrics in Charts: California Pear Harvests All Set To Kick Off
By
| 5 July 2022

In this installment of the ‘Agronometrics In Charts’ series, Sarah Ilyas studies the state of the California pear season. Each week the series looks at a different horticultural commodity, focusing on a specific origin or topic visualizing the market factors that are driving change.
Pear farmers in the River growing district of California are set to begin harvests on July 7. Most growers are planning to initiate harvests of light volume increasing the week of July 11th. The California Pear Advisory Board convened last week in Courtland to set its annual pre-season crop estimate. Total expected production for all varieties is predicted at 2,257,000 boxes. This volume includes Golden Russet Bosc and red pear varieties as well as over 200,000 boxes of organic Bartlett and Bosc pears. Last season saw volumes culminating at 3.7 K tonnes in week 32 with the harvest window spanning the period ranging from week 27 to week 44.
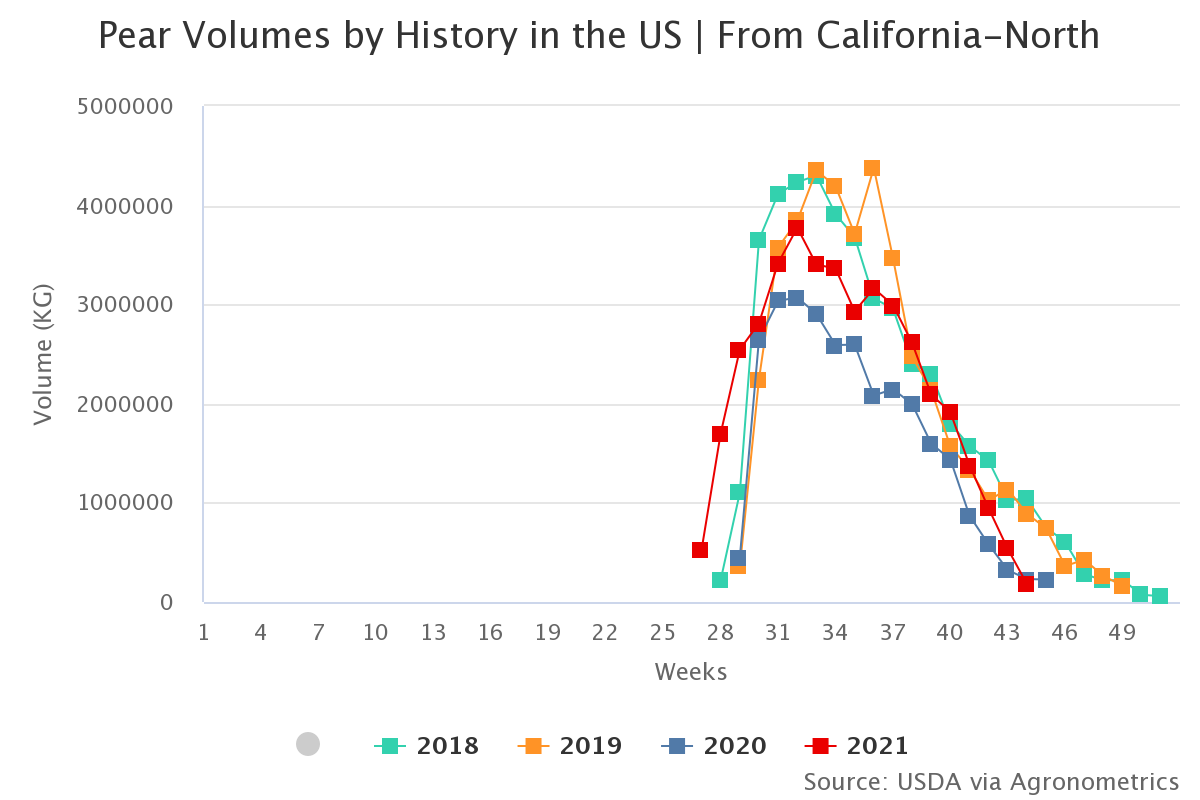
Source: USDA Market News via Agronometrics.
(Agronometrics users can view this chart with live updates here)
“California pear harvest appears to be on a normal schedule this year after two years of late harvest timing. We’ve seen pear category sales affected in recent years during July because of our late harvest. This year we expect to be picking Bartlett pears in the River District within the first weeks in July. Retailers will have no problem getting American grown pears into their stores this year,” says Matt Hemly of Greene and Hemly in Courtland.
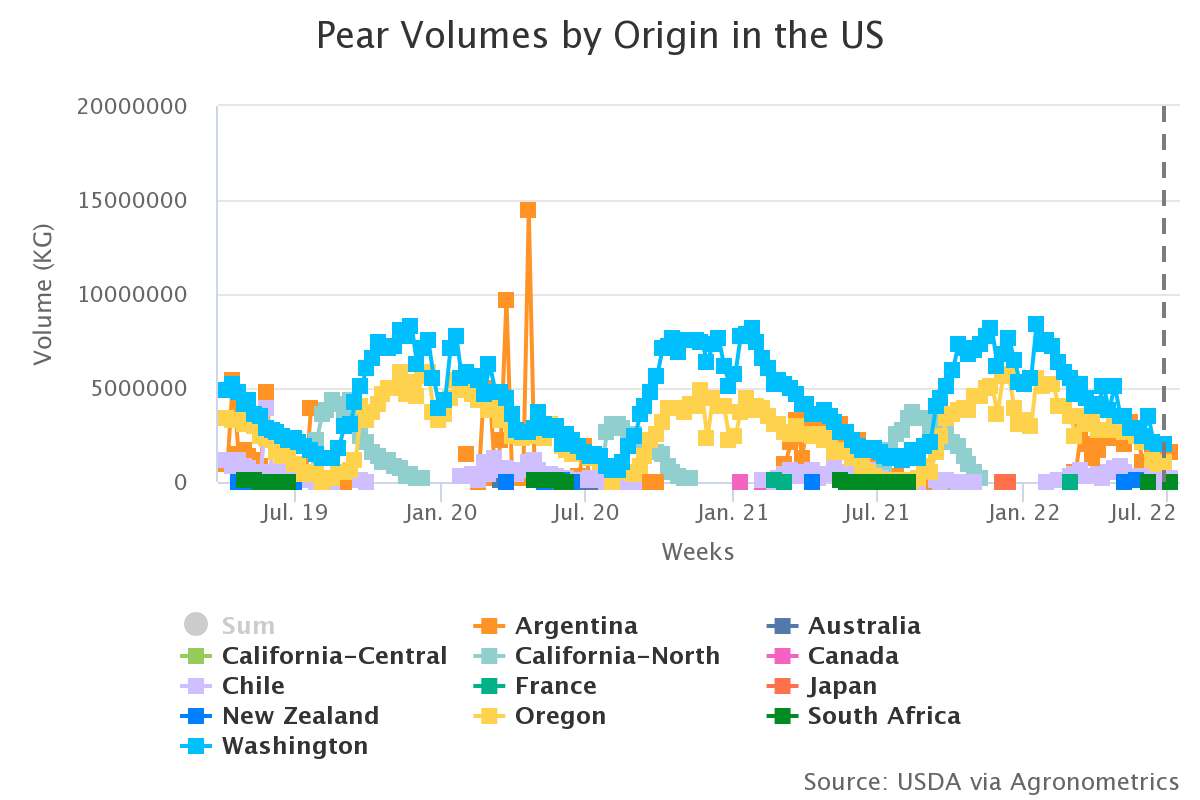
Source: USDA Market News via Agronometrics.
(Agronometrics users can view this chart with live updates here)
Last season saw prices ranging from $23.92 per package to $28.02 per package. Pricing this season will largely be dictated by demand. “It appears demand for California pears is strong this year in both the fresh and cannery markets. Growing conditions have been excellent this year to produce a uniform sized, high-quality crop,” says Chris Zanobini, Executive Director of the California Pear Advisory Board.
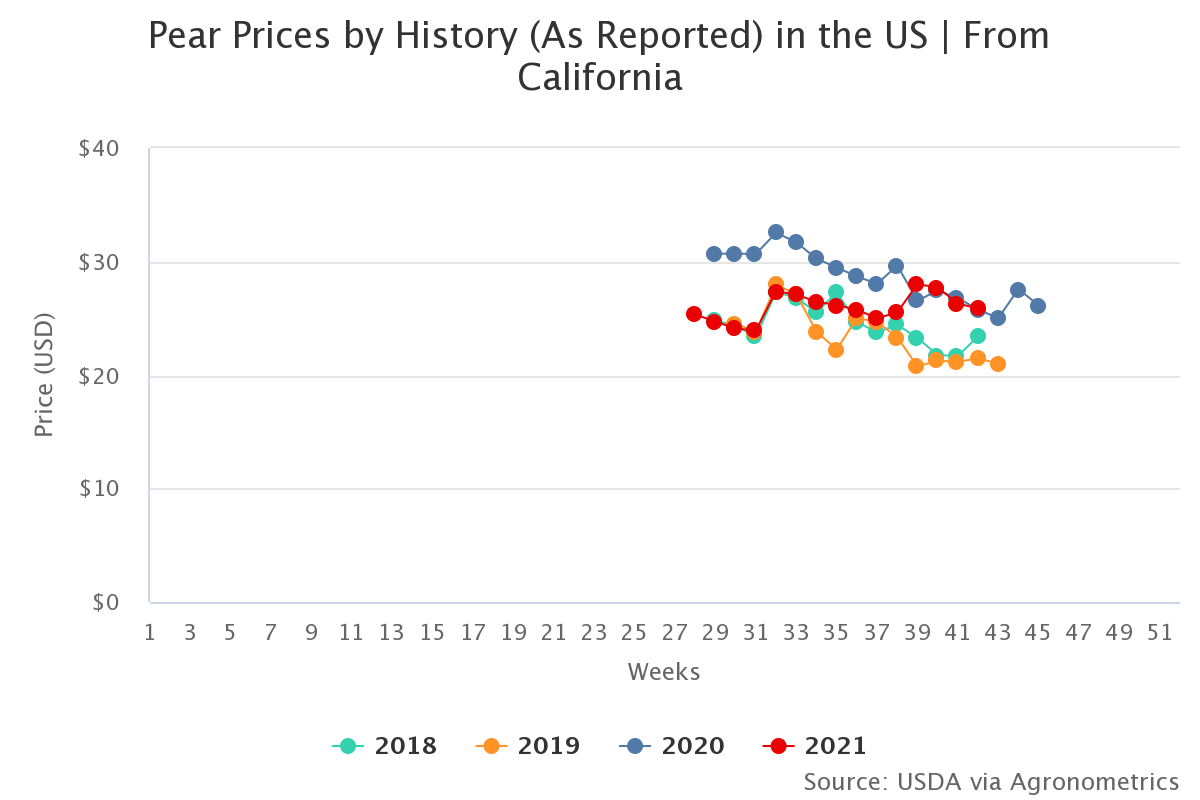
Source: USDA Market News via Agronometrics.
(Agronometrics users can view this chart with live updates here)
Consumer marketing programs have been initiated for the season in order to draw attention to ripening education for consumers with in-store signage and graphic bins being supported by several retailers, according to a release. The River growing district represents the largest volume of California pears, which is closely followed by the Lake County region. That region is expected to begin harvests on August 1. The Mendocino region is then the third-largest producer and will start harvest just after Lake County between August 1 and 5.
In our ‘In Charts’ series, we work to tell some of the stories that are moving the industry. Feel free to take a look at the other articles by clicking here.
All pricing for domestic US produce represents the spot market at Shipping Point (i.e. packing house/climate controlled warehouse, etc.). For imported fruit, the pricing data represents the spot market at Port of Entry.
You can keep track of the markets daily through Agronometrics, a data visualization tool built to help the industry make sense of the huge amounts of data that professionals need to access to make informed decisions.If you found the information and the charts from this article useful, feel free to visit us at www.agronometrics.com where you can easily access these same graphs, or explore the other 21 commodities we currently track.
Written by: Sarah Ilyas


