Agronometrics in Charts: Mexico picking up momentum on Blueberry production
By
| 15 February 2022

In this installment of the ‘Agronometrics In Charts’ series, Sarah Ilyas takes a tour of the Mexican blueberry season. Each week the series looks at a different horticultural commodity, focusing on a specific origin or topic visualizing the market factors that are driving change.
Within the past two decades, Mexico has established itself as a dominant force in the production of blueberries and has managed to bag the distinction of being the first to ‘tropicalize’ the fruit. Mexico brands itself as a winter and springtime supplier of fresh blueberries. While its peak harvests occur between February and April, the Mexican season typically runs from September to June. Growth trends in volume for Mexican blueberries are likely to persist as the country continues to make new plantations. The country boasts a great degree of grower sophistication in terms of genetics and growing techniques. Some preeminent blueberry companies have invested heavily in the northern state of Sinaloa in recent years, adding to an already prosperous sector in the Central Mexican states of Jalisco and Michoacan. These three states represent the bulk of cultivation.The Mexican berry industry is expecting a growth of between 8 and 10 percent in 2022, according to a study by Agroberichten Buitenland.
As can be observed in the graph below, the last season saw blueberries from Mexico culminating at a total imported volume of 14 M kgs, at the height of the season. The highest volume recorded for the current season was around 2 M kgs. So far in this season, Mexico has witnessed 17 percent more production compared to last year, Therefore, as the season unfolds, imported quantities may be expected to surpass preceding ones.
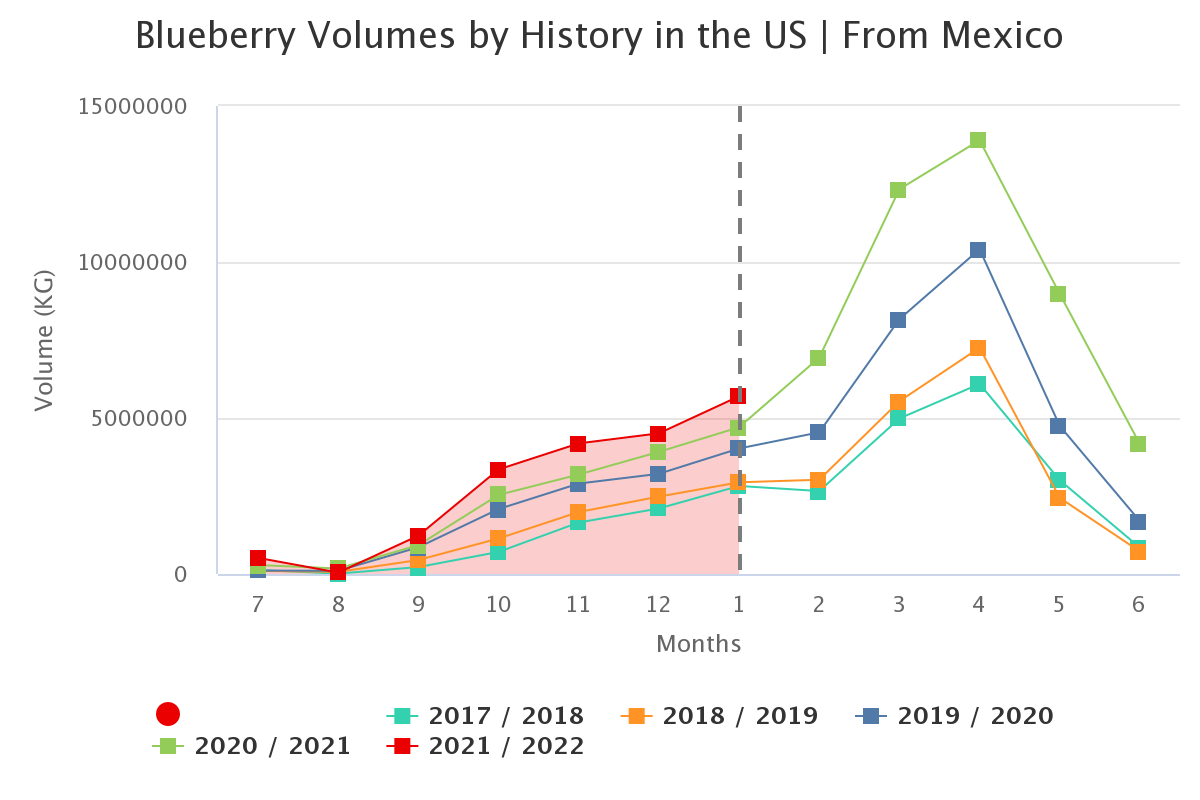
Source: USDA Market News via Agronometrics.
(Agronometrics users can view this chart with live updates here)
There are several factors providing impetus for the development of the Mexican blueberry industry. The first is the advocacy of protection technologies by the Mexican government. High tunnel and shade house technologies are the most prominent protection technologies used in Mexico. Thanks to such structures, growers can prolong the growing season and can produce high quality blueberries. The second factor is the high monetary returns of this crop, which entice growers to switch from other crops to blueberries. Mexico also tends to ship blueberries during periods when their exports incur high prices. Additionally, labor costs in Mexico are low. The competitive edge in production and labor costs offers a promising future for the industry.
Laws of supply and demand hold true when it comes to pricing. As production burgeoned, prices, in turn, took a hit following week 4. Week 5 saw blueberries being priced at $24.86 per package, a 16 percent drop compared to week 4. This reduction in prices can be attributed to the inflow of Chilean blueberries into the US market.
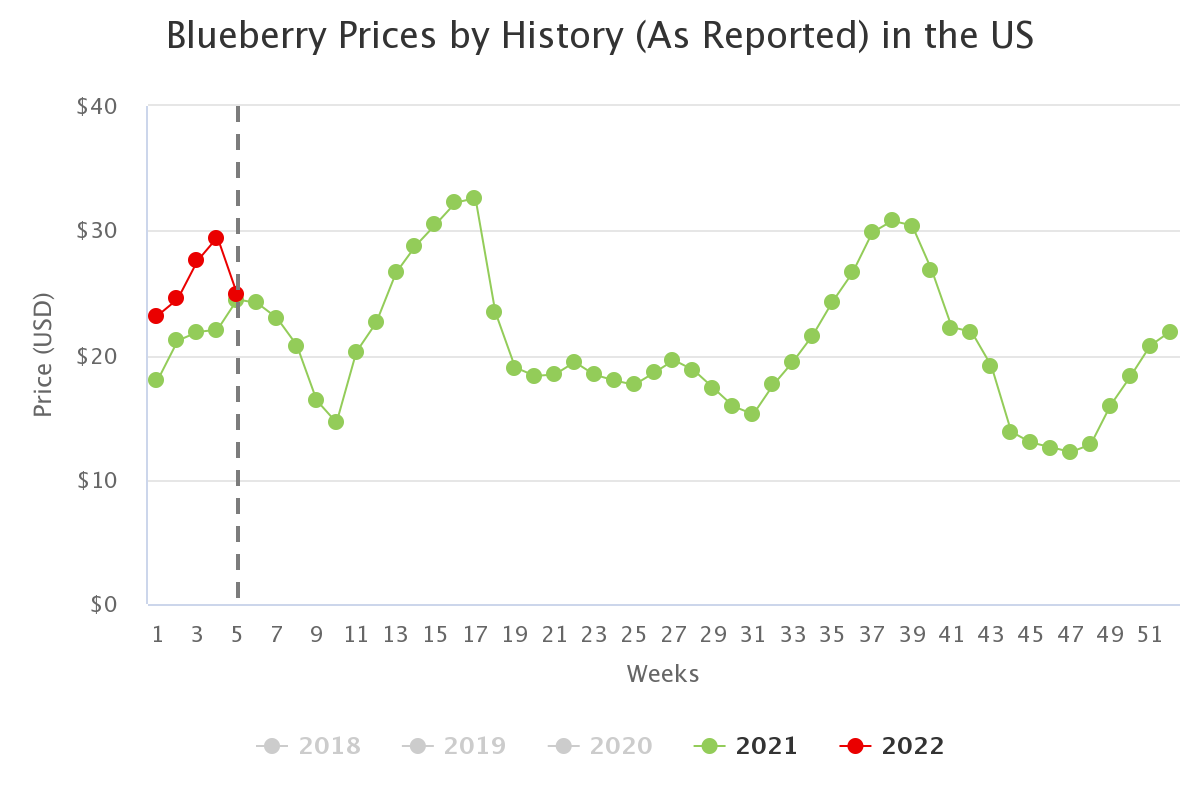
Source: USDA Market News via Agronometrics.
(Agronometrics users can view this chart with live updates here)
Week 4 saw higher volumes of Chilean blueberries entering the US market, causing blueberries prices to dwindle. Prices in the following weeks will likely be dictated by a combination of Chilean and Mexican blueberry volumes, as the Peruvian blueberry season abates.
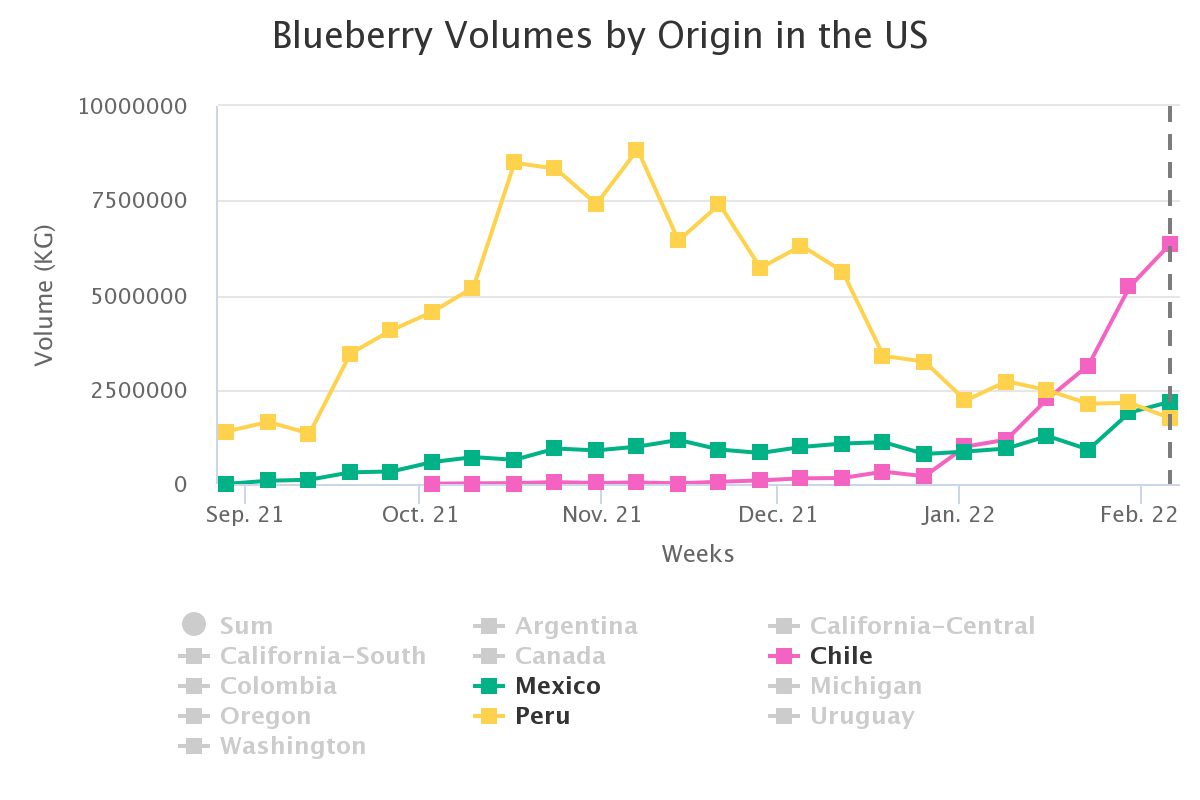
Source: USDA Market News via Agronometrics.
(Agronometrics users can view this chart with live updates here)
According to the IBO State of the Industry Report, around six major international companies have brought new genetics to Mexico; as these plantings enter maturity, the country will be set to reach its productive potential. Each state faces varying microclimates, has a different soil quality and is victim to different kinds of pests; this underscores the significance of appropriate growing methods and nuanced varietal selection for each growing region. With the adoption of new genetics and the attention of foreign investors, Mexico has the potential to outdo its competitors.
In our ‘In Charts’ series, we work to tell some of the stories that are moving the industry. Feel free to take a look at the other articles by clicking here. All pricing for domestic US produce represents the spot market at Shipping Point (i.e. packing house/climate controlled warehouse, etc.). For imported fruit, the pricing data represents the spot market at Port of Entry.
You can keep track of the markets daily through Agronometrics, a data visualization tool built to help the industry make sense of the huge amounts of data that professionals need to access to make informed decisions. If you found the information and the charts from this article useful, feel free to visit us at www.agronometrics.com where you can easily access these same graphs, or explore the other 21 commodities we currently track.
Written by: Sarah Ilyas
Original pubrilished in FreshFruitPortal.com on February 15, 2022 (Link)
Related Stories


Stemilt Growers expects promotable California cherry volume for Memorial Day ads
From
| 15 April 2024