Agronometrics in Charts: Organic Pear Volumes From Argentina Expected to Be Lower this Season
By
| 20 May 2022

In this installment of the ‘Agronometrics In Charts’ series, Sarah Ilyas studies the state of the Argentinian pear market. Each week the series looks at a different horticultural commodity, focusing on a specific origin or topic visualizing the market factors that are driving change.
Argentina’s pear season runs from late February until mid-August with Bartletts making up most of the volume, followed by D’Anjou and Bosc. Apart from the more traditional pear varieties; some artisanal varieties such as Abate Fetel also make up a significant portion of the incoming volumes. Abate Fetel is a narrow and elongated pear that’s mostly available between March and July, Alexander Lucas, another artisanal pear from Argentina, has the same window of availability and is a short and stocky green pear while Durondeau is a small golden heirloom variety that’s only available in March and April. This year, volumes for organic pears from Argentina are expected to be down considerably. “The pear season started a few weeks later than normal and appears it will end sooner than last season, the season started the first week of March rather than mid-February and will probably end by mid-July,” says Maureen Royal of Bridges Organic Produce based in Portland, Oregon. Week 19 saw a total of 3.2 K tonnes, while a total of 2 K tonnes was recorded in week 18, a decrease of roughly 37 percent compared to the previous season.
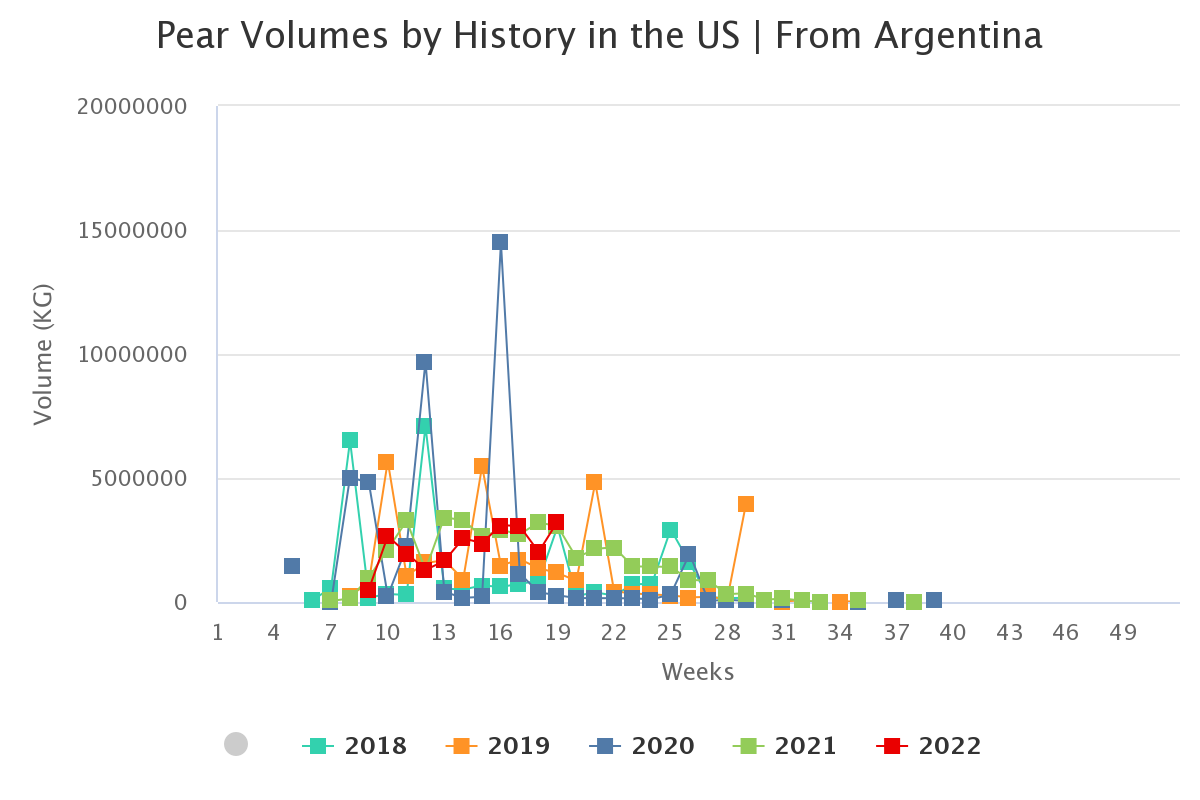
Source: USDA Market News via Agronometrics.
(Agronometrics users can view this chart with live updates here)
Trending prices for pears have been high this season, “Prices have increased due to inflation in ocean freight, land freight, warehouse storage, warehouse custom packing fees and all the costs of growing organic,” says Royal, who notes that ocean freight for example is double the price of last season. The import season is expected to conclude at the end of August or the first week of September. “Last season was unusual. It ran to October with odds and ends of varieties and sizes. This was mainly caused by shipping problems with fewer vessels available to the states and receiving delays and late arrivals at all ports. It backed up movement mid-season and slowed sales, this season has continued with some supply chain issues on vessels and arrivals. But it is not as chaotic as last year,” adds Royal.
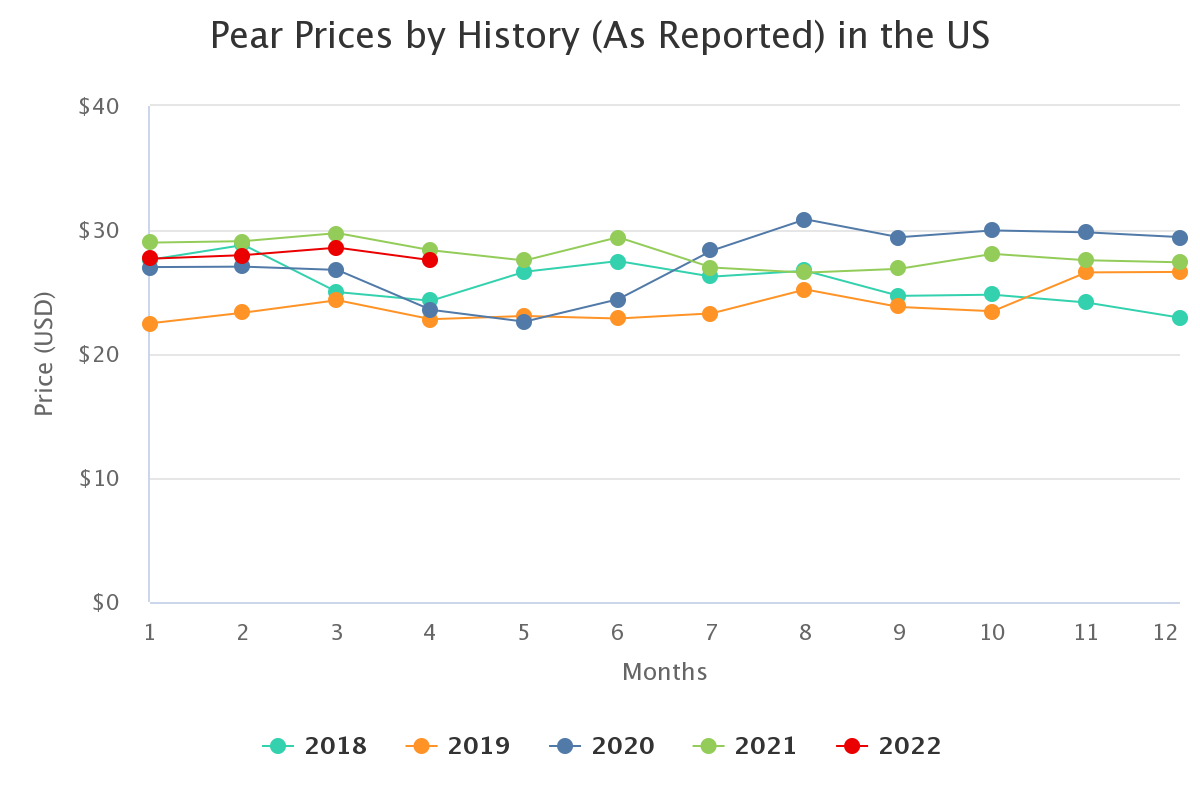
Source: USDA Market News via Agronometrics.
(Agronometrics users can view this chart with live updates here)
The lower volumes can be attributed to spring frost that was also followed up by hail storms. “The effect of these weather events was uneven due to different factors. Production in the Rio Negro valley is spread around 250 Km, so some orchards were hit by hail while others were not,” says Javier Orti, sales manager Asia for Salix Fruits. “Also, some of the bigger integrated growers/packers are well protected by sprinkler systems for frost protection and hail nets, this weather also resulted in a lower percentage of the top quality fruit that is normally shipped to the USA, Canada and Europe, and an increase in Category 2 fruit and industry-grade which is not exported,” adds Orti.
Peak stock figures in the US, however, have been climbing. WAPA, the World Apple and Pear Association, recently released the apple and pear stock figures from 1 April 2022. The figures show that in the USA, pear stocks reached 73,215 T which is 45.6% above last year, with Anjou pears increasing by about 45.2%.
In our ‘In Charts’ series, we work to tell some of the stories that are moving the industry. Feel free to take a look at the other articles by clicking here.
All pricing for domestic US produce represents the spot market at Shipping Point (i.e. packing house/climate controlled warehouse, etc.). For imported fruit, the pricing data represents the spot market at Port of Entry.
You can keep track of the markets daily through Agronometrics, a data visualization tool built to help the industry make sense of the huge amounts of data that professionals need to access to make informed decisions. If you found the information and the charts from this article useful, feel free to visit us at www.agronometrics.com where you can easily access these same graphs, or explore the other 21 commodities we currently track.
Written by: Sarah Ilyas
Related Stories
Stemilt Growers expects promotable California cherry volume for Memorial Day ads
From
| 15 April 2024