Agronometrics in Charts: Peruvian Mangoes Set Out to Capture Diverse Markets
By
| 16 June 2022

In this installment of the ‘Agronometrics In Charts’ series, Sarah Ilyas studies the state of the. Peruvian mango market. Each week the series looks at a different horticultural commodity, focusing on a specific origin or topic visualizing the market factors that are driving change.
In the last 16 years, the total export volume of Peruvian mangoes has grown by 99%, going from 8.5 million boxes to 16.9 million boxes. The value of its exports has increased by 252%. In the 2020/2021 season Peruvian mango reached an export volume of 232,683 tons. It is expected that this season will conclude with Peru exporting a total volume of 332,268 tons, which will represent an increase of 42.8% in comparison to the previous season. The increase in exports can be attributed to the expansion in production areas and the new markets that Senasa is setting out to open. In January, South Africa became the most recent market that approved Peruvian mango imports after the South African phytosanitary authority approved Peru’s sanitary standards. Senasa expanded its market sphere during the past decade and captured markets such as Japan, Uruguay, South Korea, and now South Africa. It is expected that more markets will open in the next couple of years and that the mango production area that currently stands at 17,000 hectares will keep growing to keep up with the growing demand. According to Senasa, Peru has 6,762 certified mango production farms mainly located in Piura, Lambayeque, and Ancash, 89% of which are small with less than five hectares of land destined for mango production. Peru is the 4th largest mango exporter globally. The main export destinations are the Netherlands, the USA, and France.The 2021/2022 season is presenting many threats to the mango crops worldwide causing a drop in production due to unsuitable weather. The decrease in the global supply of mango is an opportunity that Peru can use to its advantage.
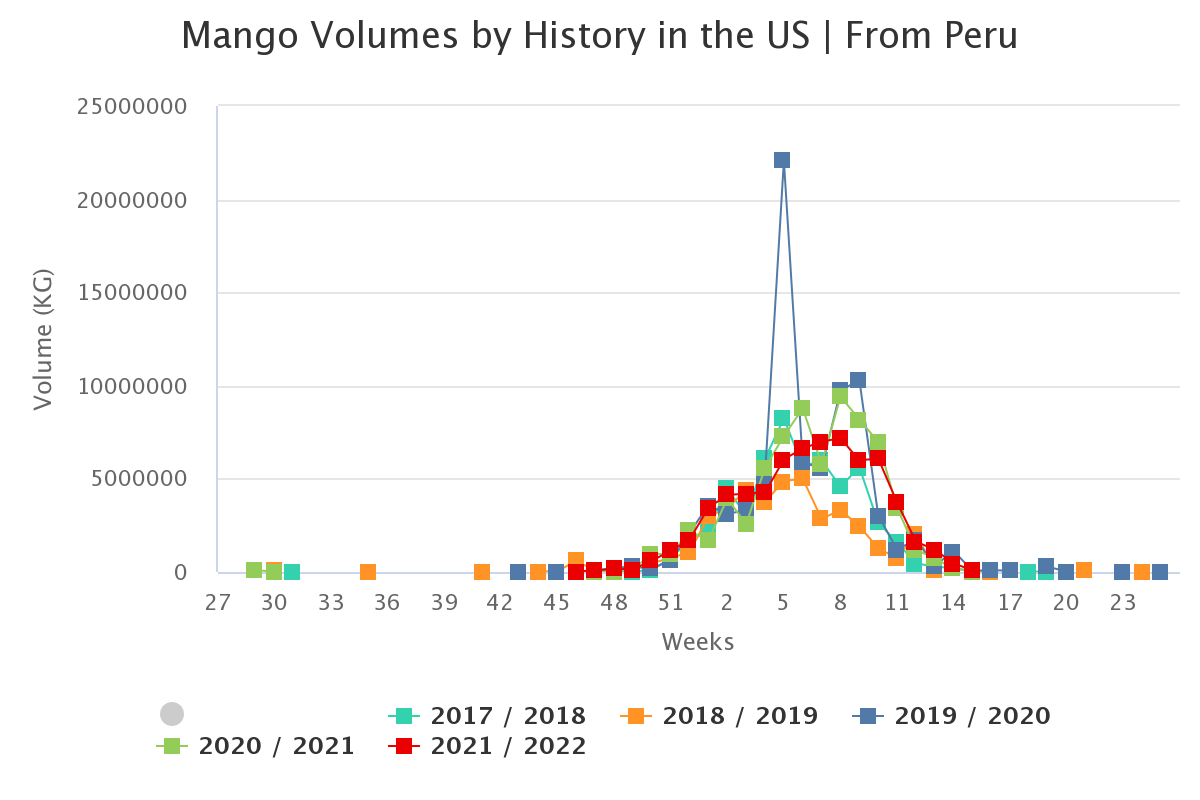
Source: USDA Market News via Agronometrics.
(Agronometrics users can view this chart with live updates here)
This season, the US lost its spot as the biggest importer of Peruvian mangoes. “Europe is always the main market for fresh mangoes from Peru, but this campaign the percentage of shipments to said destination has intensified, while its participation to the U.S. has decreased,” says Juan Carlos Rivera Ortega, the general manager of the Peruvian Association of Mango Producers and Exporters (APEM). Prices recorded this season ranged from $4.81 per package to $8.18 per package.
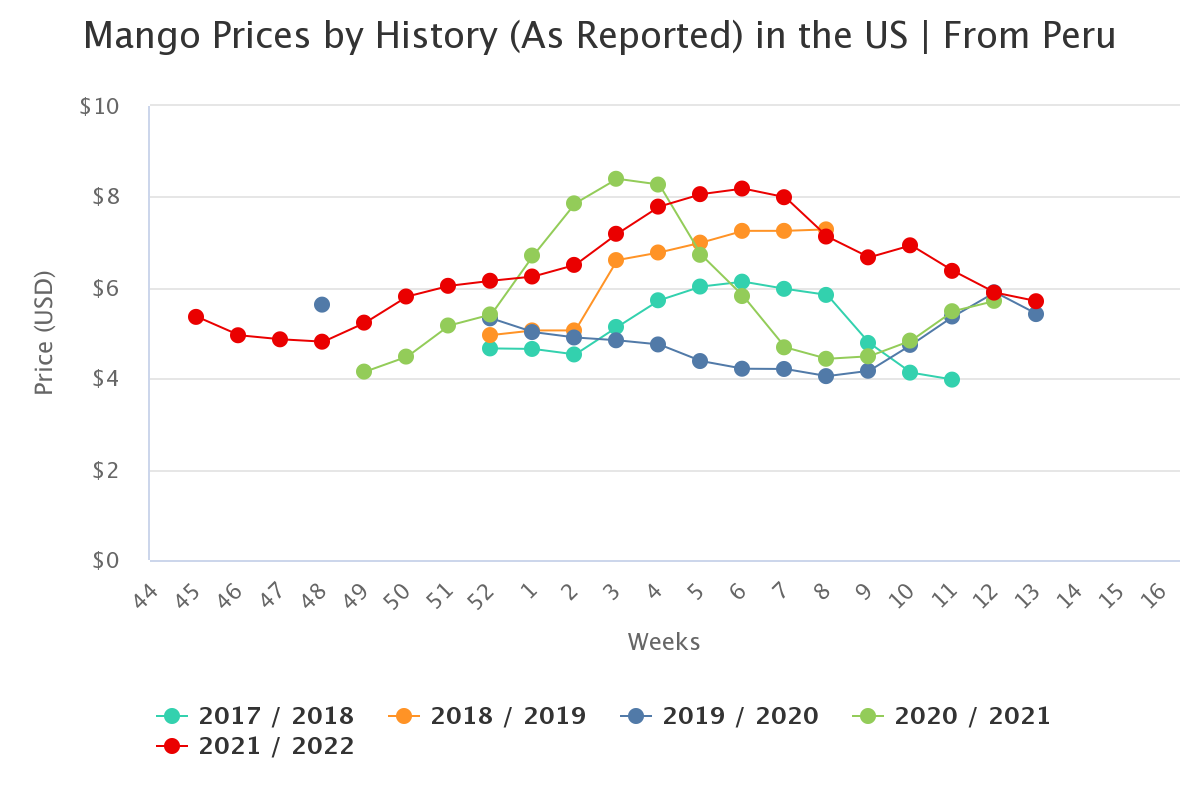
Source: USDA Market News via Agronometrics.
(Agronometrics users can view this chart with live updates here)
The mango harvest in Peru plays a key role in the world market for fresh and frozen mangoes, 90% of the mango exports from Peru are the Kent variety, the remaining 10% are the Haden Keitt and Tommy Atkins varieties. Peru’s mango harvest window occurs at the beginning of the year which allows it to be a significant link in the international mango trade; it determines the prices that are governed during the first half of the year until Mexico’s mango harvest window opens. Each year, more mangoes are being destined for frozen products since their durability can reach up to 2 years. Mangoes are frozen between -18 ° and -20 °. The process is known as IQF, Individual Quick Freeze.
In our ‘In Charts’ series, we work to tell some of the stories that are moving the industry. Feel free to take a look at the other articles by clicking here.
All pricing for domestic US produce represents the spot market at Shipping Point (i.e. packing house/climate controlled warehouse, etc.). For imported fruit, the pricing data represents the spot market at Port of Entry.
You can keep track of the markets daily through Agronometrics, a data visualization tool built to help the industry make sense of the huge amounts of data that professionals need to access to make informed decisions.If you found the information and the charts from this article useful, feel free to visit us at www.agronometrics.com where you can easily access these same graphs, or explore the other 21 commodities we currently track.
Written by: Sarah Ilyas
Related Stories
Stemilt Growers expects promotable California cherry volume for Memorial Day ads
From
| 15 April 2024