Agronometrics in Charts: Relief in sight for soaring Mexican avocado prices
By
| 27 June 2022

In this installment of the ‘Agronometrics In Charts’ series, Sarah Ilyas studies the state of Mexico’s avocado season. Each week the series looks at a different horticultural commodity, focusing on a specific origin or topic visualizing the market factors that are driving change.
The Jalisco avocado sector maintains commercial openness with more than 30 countries including Canada, Japan, Spain, United Arab Emirates, Russia, Belgium, Netherlands, France, United Kingdom, Uruguay, Portugal and Germany, exporting more than 113,000 tons (249 million pounds) of avocados, with the US soon to join. By entering the U.S. market, Jalisco will establish a new precedent for Mexican avocado exports, making it likely that other states such as Nayarit would soon follow suit. This presents an opportunity for economic growth, since avocados are the second agri-food product that generate the most revenue for the country in terms of exports. The approved date to begin shipping into the U.S. is June 15th.
“Supplies from Jalisco will help things out. We’re going to be very valuable to the supply chain to help supply avocados year-round to meet the demand that keeps increasing. It will help give that stability that everyone is looking for in the supply chain,” says Juan Escorcia of Escagui Avocados Inc. based in Chula Visa, California.
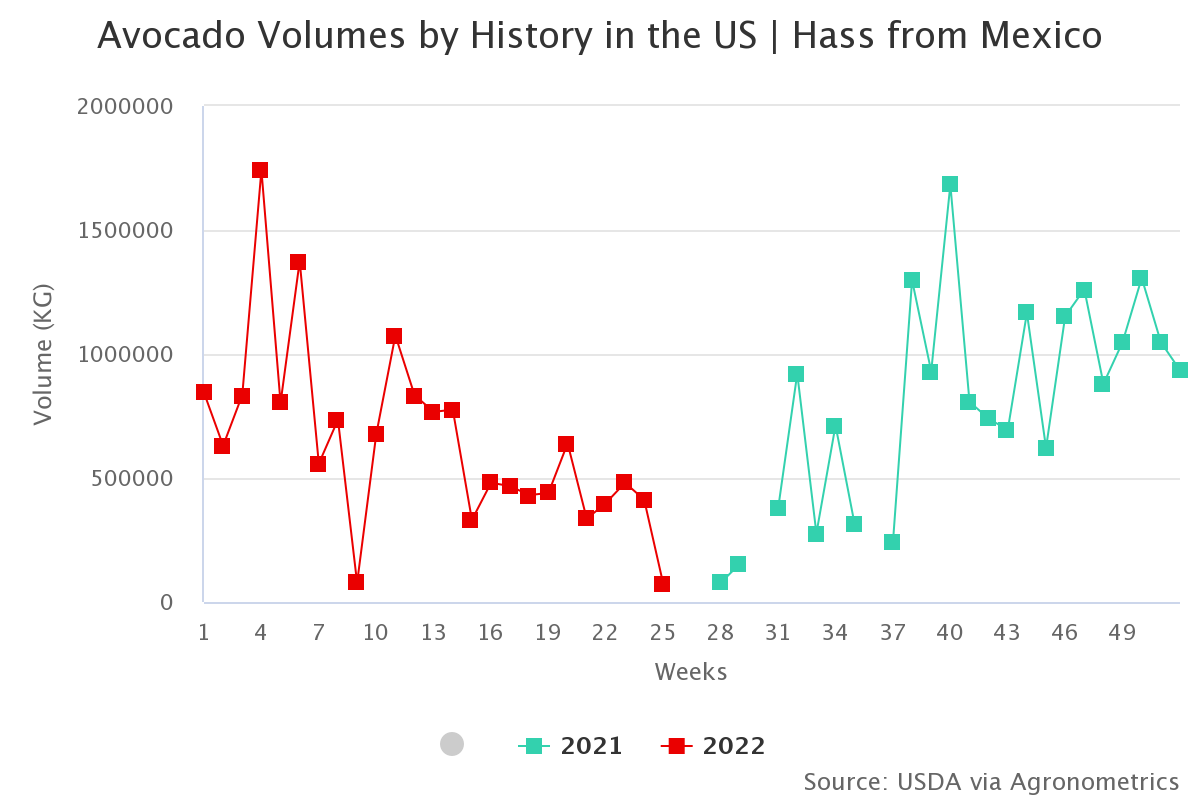
Source: USDA Market News via Agronometrics.
(Agronometrics users can view this chart with live updates here)
The trending prices for avocados are currently high as Michoacán rounds up its existing crop and prepares for new crop fruit. Prices are expected to come down towards the end of June and early July owing to the new incoming fruit. Currently, however, there’s less supply and high demand which is causing prices to be inflated. The crop coming out of Mexico this year is much smaller compared to last year. Escorcia says that the early fruit from Michoacán will likely be somewhat slower to move. “That brand new fruit will take longer to ripen. The lower dry matter means it will take longer to get ready to eat, even though there are a lot of ripening programs in different markets now,” Escorcia says. “The inventory won’t move as fast and importers will also take a little longer.” Prices reached their pinnacle in week 25, at $80 per kg. The last time prices were this high was in June 2019.
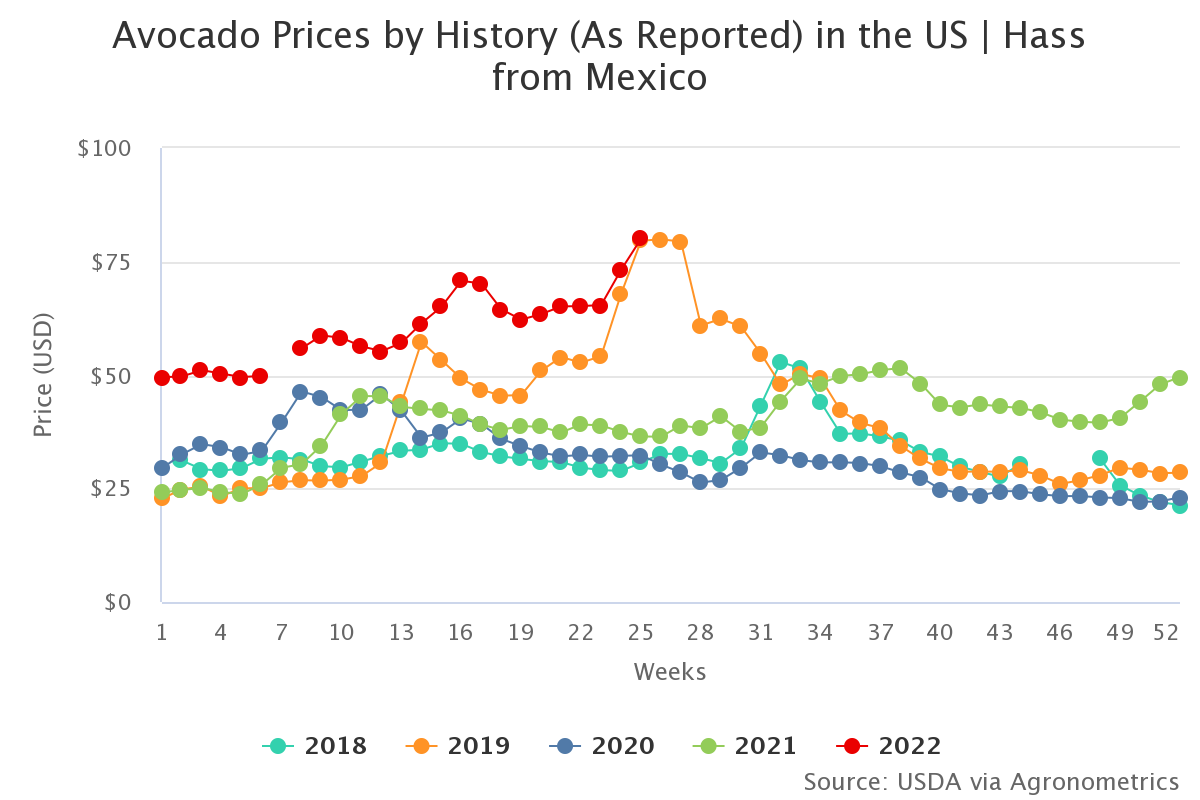
Source: USDA Market News via Agronometrics.
(Agronometrics users can view this chart with live updates here)
Despite these setbacks, Escorcia claims that relief is on the horizon. “Supplies from Jalisco will help things out. We’re going to be very valuable to the supply chain to help supply avocados year-round to meet the demand that keeps increasing. It will help give that stability that everyone is looking for in the supply chain,” he adds.
In our ‘In Charts’ series, we work to tell some of the stories that are moving the industry. Feel free to take a look at the other articles by clicking here.
All pricing for domestic US produce represents the spot market at Shipping Point (i.e. packing house/climate controlled warehouse, etc.). For imported fruit, the pricing data represents the spot market at Port of Entry.
You can keep track of the markets daily through Agronometrics, a data visualization tool built to help the industry make sense of the huge amounts of data that professionals need to access to make informed decisions.If you found the information and the charts from this article useful, feel free to visit us at www.agronometrics.com where you can easily access these same graphs, or explore the other 21 commodities we currently track.
Written by: Sarah Ilyas