
Agronometrics in Charts: The Last of the Argentinian Pear Harvests
By
| 22 March 2022

In this installment of the ‘Agronometrics In Charts’ series, Sarah Ilyas studies the abatement of the Argentinian pear season. Each week the series looks at a different horticultural commodity, focusing on a specific origin or topic visualizing the market factors that are driving change.
Argentina is the world’s second-largest exporter of pears and dominates the Southern Hemisphere pear market. About 3000 known varieties of pears are grown worldwide, with distinct varieties in both shape and taste. Pears are consumed fresh, canned, as juice, or dried. The juice can also be used in jellies and jams, usually in combination with other fruits, including berries. Some of the pear varieties grown in Argentina include the Williams Bon Chrétien variety, the Packhams Triumph, the Beurré D’Anjou variety, Red Bartlett, Abate Fetel, and others such as Beurre Bosc, Beurré Giffard, Clapps and red Beurré D’Anjou. Due to spring frost and hail storms, volumes this season are projected to be low. According to one estimate, smaller independent growers in Argentina lost 30 to 50 percent of their crops while bigger ones lost 5 to 15 percent owing to the harsh weather conditions. “This weather also resulted in a lower percentage of the top quality fruit that is normally shipped to the USA, Canada and Europe, and an increase in Category 2 fruit, an industry-grade which is not exported,” says Javier Orti, sales manager Asia for Salix Fruits. Volumes in week 9 this season stood at 521 K kgs while those in week 10 were at 2.1 K tonnes. The harvests kick off in late December/early January for the early varieties (Clapps, Giffard), around January 10 for Williams and from early February for Abate and Packhams. The last pear harvests are expected to take place around March 19.
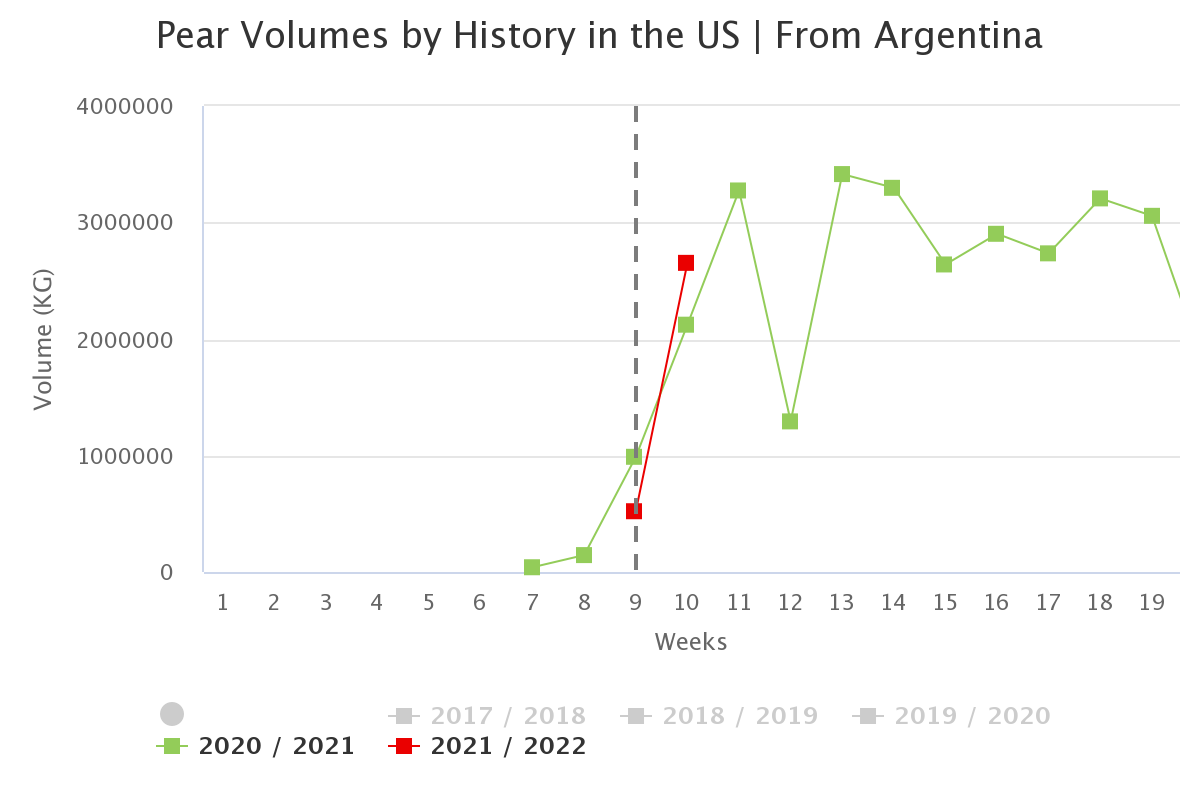
Source: USDA Market News via Agronometrics.
(Agronometrics users can view this chart with live updates here)
Most produce comes from the Rio Negro Valley and is in direct contention with South Africa and Chile. Currently, the Williams variety is peaking in Argentina. Abate Fetel, Anjou and Packham’s are following suit. As for pricing, “Argentina is facing higher production costs as the impact of fixed costs over a smaller crop is significant,” says Orti. Prices in week 10 were at $28.44 per package, a 5 percent slump compared to the previous season.
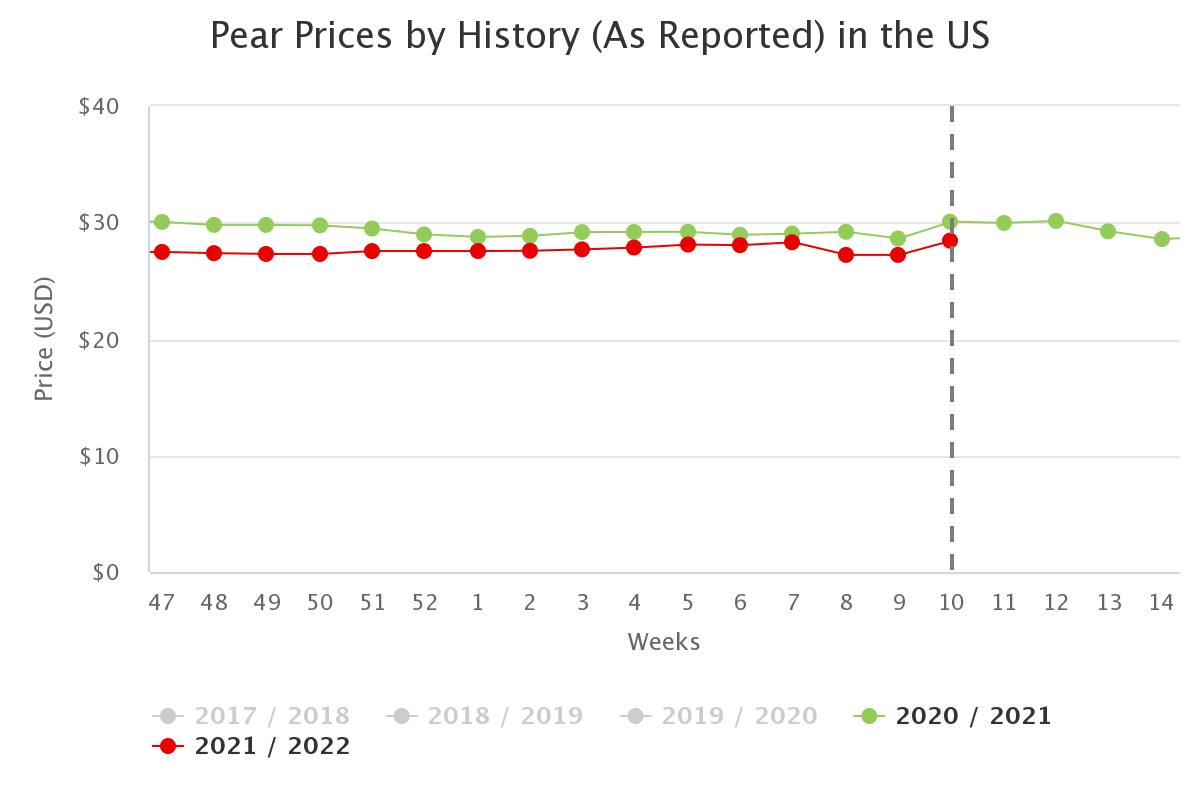
Source: USDA Market News via Agronometrics.
(Agronometrics users can view this chart with live updates here)
According to WAPA’s latest forecasts, the Southern Hemisphere growers are expecting a 6% decrease in the crop this year, with cumulative volumes dropping to 1,229,000 T. This is mainly due to a 13% drop in Argentina, an 11% decrease in Chile, and a 6% decrease in Australia. New Zealand and South Africa, on the other hand of the spectrum, are expected to ramp up their production by 31% and 5% respectively. Argentina stands as the largest producer in the Southern Hemisphere followed by South Africa, Chile, Australia and New Zealand. Packham’s Triumph remains the most produced variety, followed by Williams’ bon chrétien pears.
In our ‘In Charts’ series, we work to tell some of the stories that are moving the industry. Feel free to take a look at the other articles by clicking here.
All pricing for domestic US produce represents the spot market at Shipping Point (i.e. packing house/climate controlled warehouse, etc.). For imported fruit, the pricing data represents the spot market at Port of Entry.
In our ‘In Charts’ series, we work to tell some of the stories that are moving the industry. Feel free to take a look at the other articles by clicking here. All pricing for domestic US produce represents the spot market at Shipping Point (i.e. packing house/climate controlled warehouse, etc.). For imported fruit, the pricing data represents the spot market at Port of Entry.
You can keep track of the markets daily through Agronometrics, a data visualization tool built to help the industry make sense of the huge amounts of data that professionals need to access to make informed decisions. If you found the information and the charts from this article useful, feel free to visit us at www.agronometrics.com where you can easily access these same graphs, or explore the other 21 commodities we currently track.
Written by: Sarah Ilyas


