
Agronometrics in Charts: WAPA publishes February’s pear stock figures
By
| 7 March 2022

In this installment of the ‘Agronometrics In Charts’ series, Sarah Ilyas studies the state of the pear market in the US. Each week the series looks at a different horticultural commodity, focusing on a specific origin or topic visualizing the market factors that are driving change.
Pears are one of the world’s oldest cultivated fruits. Colonists brought the first pear trees to America’s eastern regions. Today, pears are a significant commercial crop grown in at least six US states: Washington, Oregon, California, Michigan, New York, and Pennsylvania. The production of pears has ramped up in these states over the years, due to the fact that the climates here are conducive to their growth. Pears have special phytonutrients, including anti-inflammatory flavonoids, anticancer polyphenols, and anti-aging flavonoids. The fruit is also a source of vitamin C and vitamin K. It helps reduce inflammation, which is oftentimes the root cause of illnesses. Increasing health consciousness and the rise in demand for organic fruits act as the impetus for the growth of the pear market.
WAPA, the World Apple and Pear Association recently released its pear stock figures from February 1, 2022. In the US, pear stocks reached 149,553 tonnes, showing a growth of about 31.9 percent compared to 2021. “Seasonal developments clearly show the consequences of logistics and international trade costs, including for suppliers in the Northern Hemisphere, where sales of apples and pears in the United States are concentrated in North America”, says Philip Benard, Secretary General, WAPA. The incoming volumes this year were, on average, higher than those recorded in 2021. Week 8 saw 9.4 K tonnes flowing in, an increase of roughly 7 percent compared to the last year. Peak volumes this season were recorded in week 2, at 13.9 K tonnes.
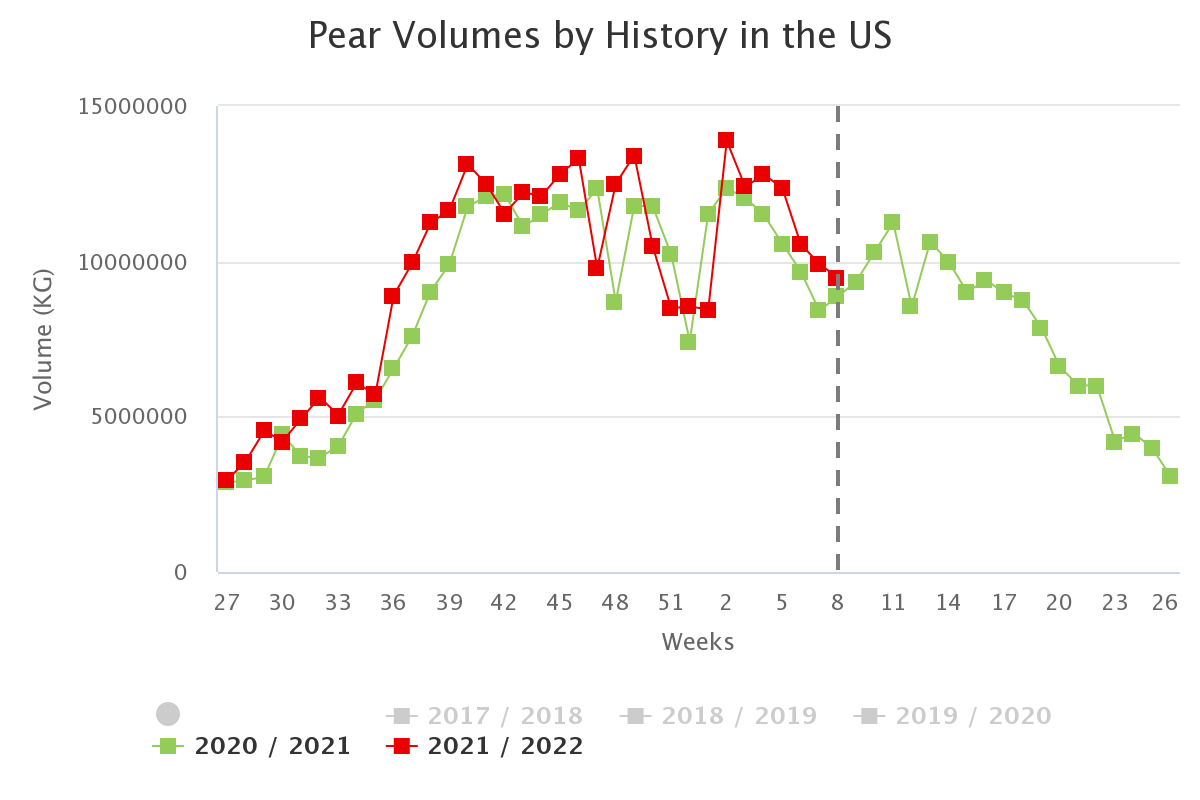
Source: USDA Market News via Agronometrics.
(Agronometrics users can view this chart with live updates here)
In modern day agriculture, pears are a vital commercial crop, and just like their close cousins – apples, represent a compelling investment case for anyone looking to put in capital into farmland. Conforming with the price trends observed in the last season, prices this season were stable, for the most part. However, the rates witnessed were lower compared to the last season.
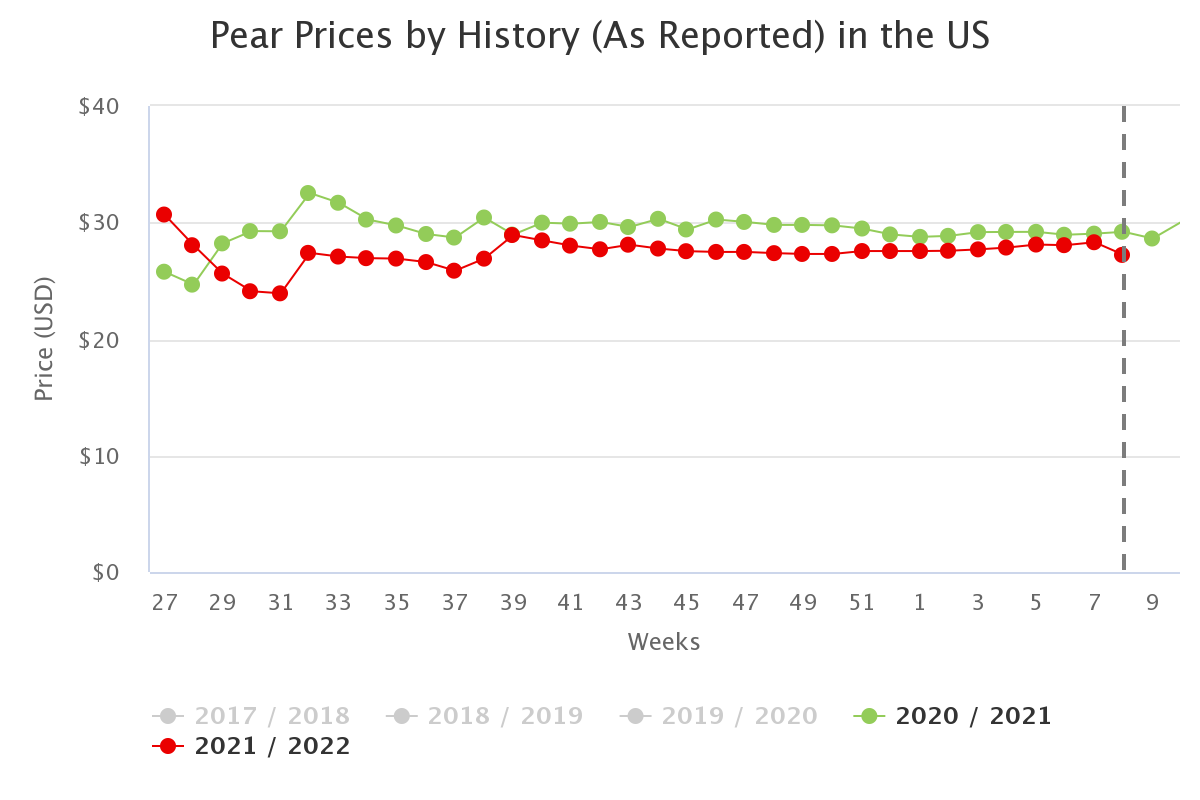
Source: USDA Market News via Agronometrics.
(Agronometrics users can view this chart with live updates here)
Pears are at a favorable position to take advantage of the unprecedented growth in the organic produce market witnessed in the US over the last decade. US organic produce sales crossed $60B in 2020, having grown at around 10% per year since 2008, and are expected to reach $70B by 2025. Certified Organic pear acreage in Washington nearly tripled between 2014 and 2019, and is continuing its growth in support of the surge in the organic segment of the pear market.
In our ‘In Charts’ series, we work to tell some of the stories that are moving the industry. Feel free to take a look at the other articles by clicking here.
All pricing for domestic US produce represents the spot market at Shipping Point (i.e. packing house/climate controlled warehouse, etc.). For imported fruit, the pricing data represents the spot market at Port of Entry.
You can keep track of the markets daily through Agronometrics, a data visualization tool built to help the industry make sense of the huge amounts of data that professionals need to access to make informed decisions. If you found the information and the charts from this article useful, feel free to visit us at www.agronometrics.com where you can easily access these same graphs, or explore the other 21 commodities we currently track.


