Avocados in Charts – Record volumes send prices to bellow pre-stike levels
By
| 18 December 2018

Bellow is the exact same chart I use to open my previous article Avocados in Charts: How does the Mexican growers’ strike compare to 2016?. If you haven’t read it yet, I highly recommend it, as pretty much every scenario laid out has played out as expected.
So moving forward in time five weeks we can see very clearly the effects of the strike which started affecting the markets on the 30th of October. A massive gap in shipments complemented by rising prices, followed immediately by a huge swell in volume quickly bringing prices down even below pre-strike levels.
US Monthly Grape Shipping Point Historical Prices
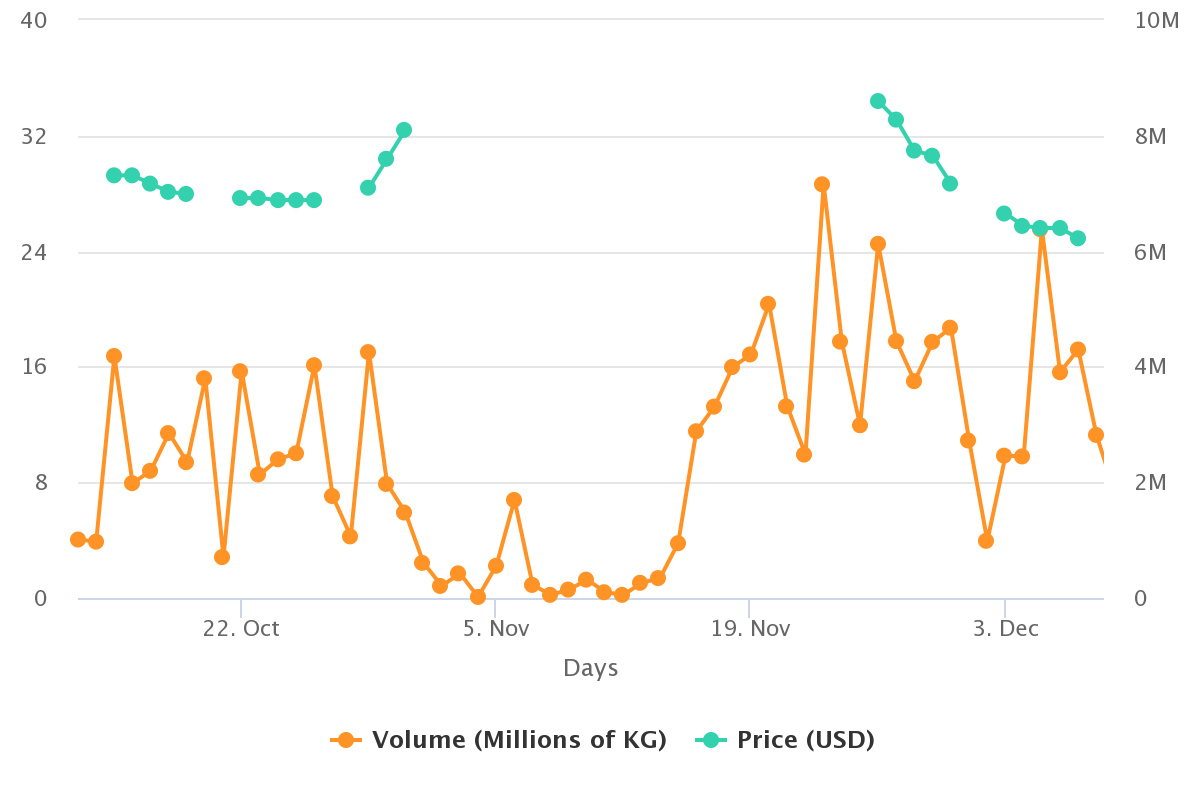
(Source: USDA Market News via Agronometrics)
[Agronometrics users can view this chart with live updates here]
[Agronometrics users can view this chart with live updates here]
Comparing the last four years of volume data aggregated weekly the effects of the strike are even more pronounced. Hitting not only the lowest volume that any one week has recorded in the last four years, but quickly spiking, setting a new record for the most volume ever shipped week 47, which is also the second highest volume ever recorded. The highest being week 1 of 2016, which I actually suspect might have been an accounting error by the USDA’s reporting system, as the week prior had an unusually low volume and doesn’t really match up with the trends observed the last couple of years.
US Monthly Grape Historical Volumes (KG)
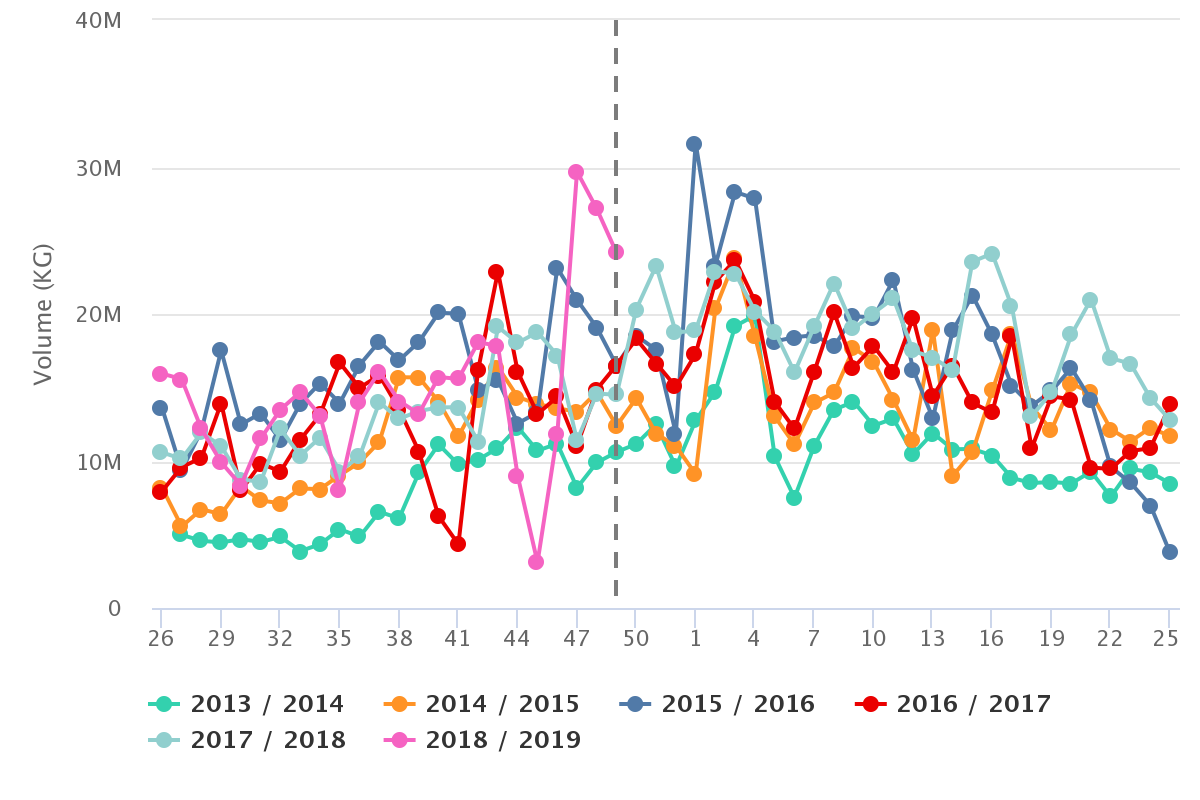
(Source: USDA Market News via Agronometrics)
[Agronometrics users can view this chart with live updates here*]
[Agronometrics users can view this chart with live updates here*]
So after 16 days of striking and a massive shock to the markets, what does this all add up to? In the article by FreshFruitPortal Mexican avocado strikes end as agreement is reached
Ramon Paz, a spokesperson for the association, said that the parties had “agreed to increase the transparency of information so that everyone knows the reality of the market, the costs and the marketing margins.”. This last point was exactly what I had suggested in the last article and something that I strongly encourage. I also mentioned, I believe that there are a lot of reasons why the supply chain isn’t as transparent as it could be, but with a renewed emphasis on the subject I am very curious to see what the industry will come up with.
Written by: Colin Fain
Originally published in FreshFruitPortal.com on December 18, 2018 (Link)
*To view historics click on this icon  in the table. In the historics report you can change viewing to reflect seasons that cross New Years.
Related Stories