Blueberries In Charts: Higher market volumes lead to price cuts
By
| 30 July 2019

This week’s installment of In Charts is a bit different from most. With the focus of compacting a big punch as simply and clearly as possible, today’s report focuses on how the blueberry markets have developed over the last three months with one dramatic chart and an adjoining table.
Blueberry prices and volumes
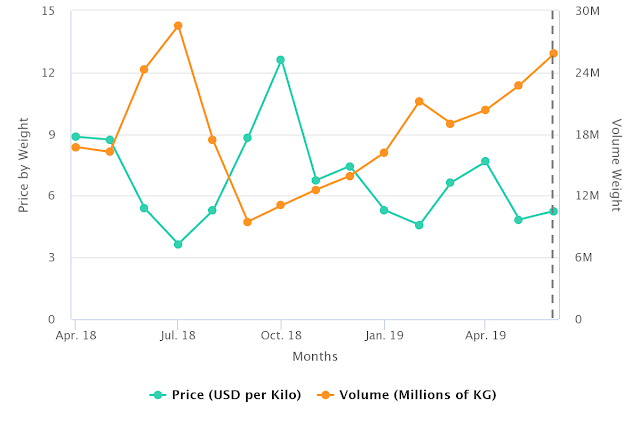

Source: USDA Market News via Agronometrics. (Agronometrics users can
view this chart with live updates here)
The last three months have been a rocky ride for U.S. blueberry markets; they have seen a 20% increase in category volume over the same period last year. As a result, prices have decreased by 23%. And this sizable drop has shaken up many producers.
The biggest contributor to this glut was Georgia, as the state sent 58% more blueberries into the domestic market than last year. The state also served as the period’s largest producing origin.
Although prices in this state changed the most compared to other producing areas, cuts in costs hit all origins. Even states like Florida, which sent similar volumes to last year, took a 25% discount on blueberry prices this year.
Quarter 2 Average Price and Sum of Volume compared to Q2 2018
| Origin | Price per Kilo | % Change on 2018 | Volume KG | % Change on 2018 |
| Average/Sum | $5.92 | -23% | 69,892,768 | 20% |
| California | $6.07 | -24% | 9,947,448 | 36% |
| Florida | $6.47 | -25% | 8,944,992 | 6% |
| Georgia | $4.87 | -27% | 18,134,928 | 58% |
| Mexico | $6.32 | -21% | 11,875,248 | 19% |
| New Jersey | $4.25 | -11% | 8,087,688 | 9% |
| North Carolina | $4.76 | -25% | 9,629,928 | 6% |
| Washington and Oregon | $5.52 | -3% | 1,837,080 | -4% |
Written by: Colin Fain
Original published in FreshFruitPortal.com on July 30, 2019 (Link)
Related Stories