Blueberries In Charts – Higher prices are coming!
By
| 6 August 2019
After a well-supplied market saw a period of low prices, the blueberry industry is holding onto their seats, waiting for prices to rise. In fact, they should see this increase in the next couple of weeks. To illustrate the data behind this forecast, the chart below shows the historical trend of prices steadily rising from week 30 to week 40.
Historical U.S. shipping point prices per kilo by week
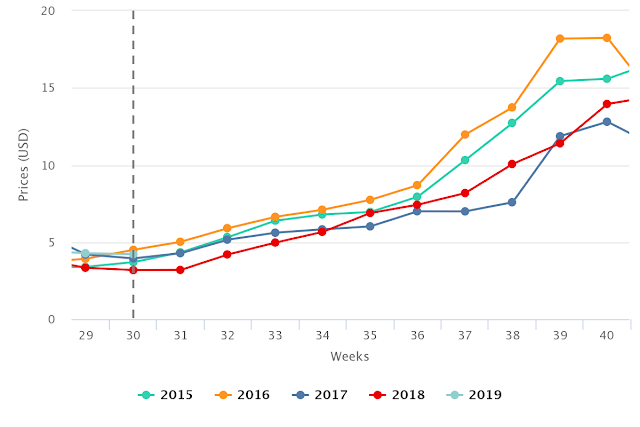
Source: USDA Market News via Agronometrics. (Agronometrics users can
view this chart with live updates here)
This trend follows the strong seasonality of the blueberry industry, with July reporting the lowest average prices of the year. From there, the industry saw two peaks around April and October.
Interestingly, the period between July and October shows the largest difference in pricing of the entire year’s offering.
Historical U.S. shipping point prices per kilo by month
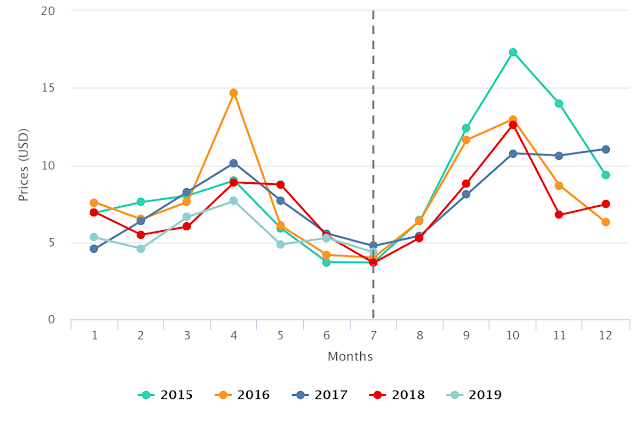
Source: USDA Market News via Agronometrics. (Agronometrics users can
view this chart with live updates here)
To bring these prices into context, it’s important to look at the blueberry volumes shown in the chart below. These reflect an inverse of pricing; they also demonstrate a sharp drop from August to September. The category volumes stay low until November, and this period accounts for the lowest volumes of the year.
Historical U.S. market blueberry volumes
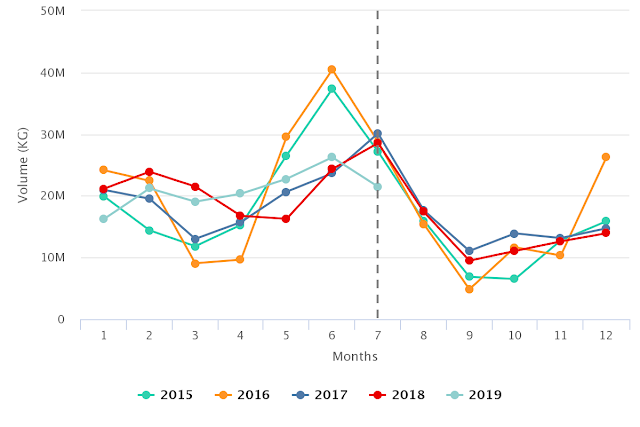
Source: USDA Market News via Agronometrics. (Agronometrics users can
view this chart with live updates here)
Looking at the data, readers can appreciate the important volumes available from the U.S. and Canada in July, yet as the supplies from these two origins wind down, the volumes fall off. Afterward, Peru’s fruit begins to arrive on the market and has a strong presence on the market in September. Volumes begin to rise again in October and November with Argentina’s blueberry shipments.
2018 U.S. blueberry volumes by origin
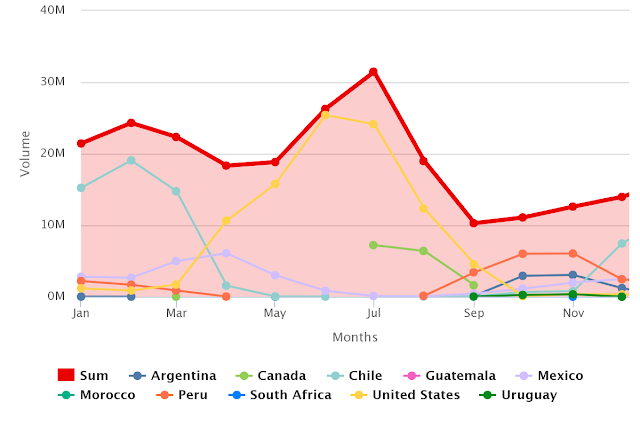
Source: USDA Market News via Agronometrics. (Agronometrics users can
view this chart with live updates here)
Written by: Colin Fain
Original published in FreshFruitPortal.com on August 06, 2019 (Link)
Related Stories