Downward adjustment for Mexican table grape production
From
| 16 June 2022

Overview of table grapes from Mexico in the U.S. market, complemented by charts from Agronometrics. Original published on June 15, 2022.
As Sonora passes the halfway point of the 2022 table grape season, the grower-members of AALPUM make a statement to the supply chain partners.
In the broadest terms, it can be said that the traditional, conventional varieties had more of a medium size, such as Flame Seedless in May 2022, while ‘patented’ varieties remained large to extra-large. This loss of volume in the first half of the season cannot be recovered, thus affecting the numbers of June.
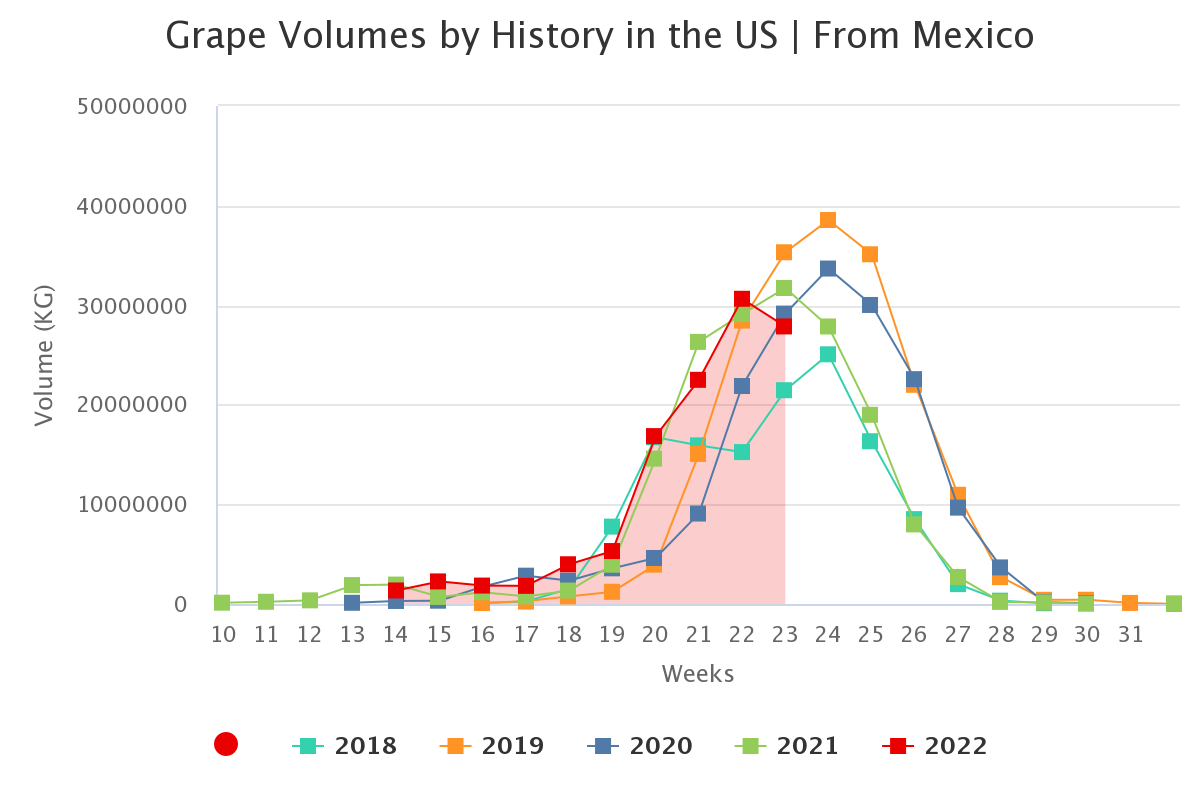
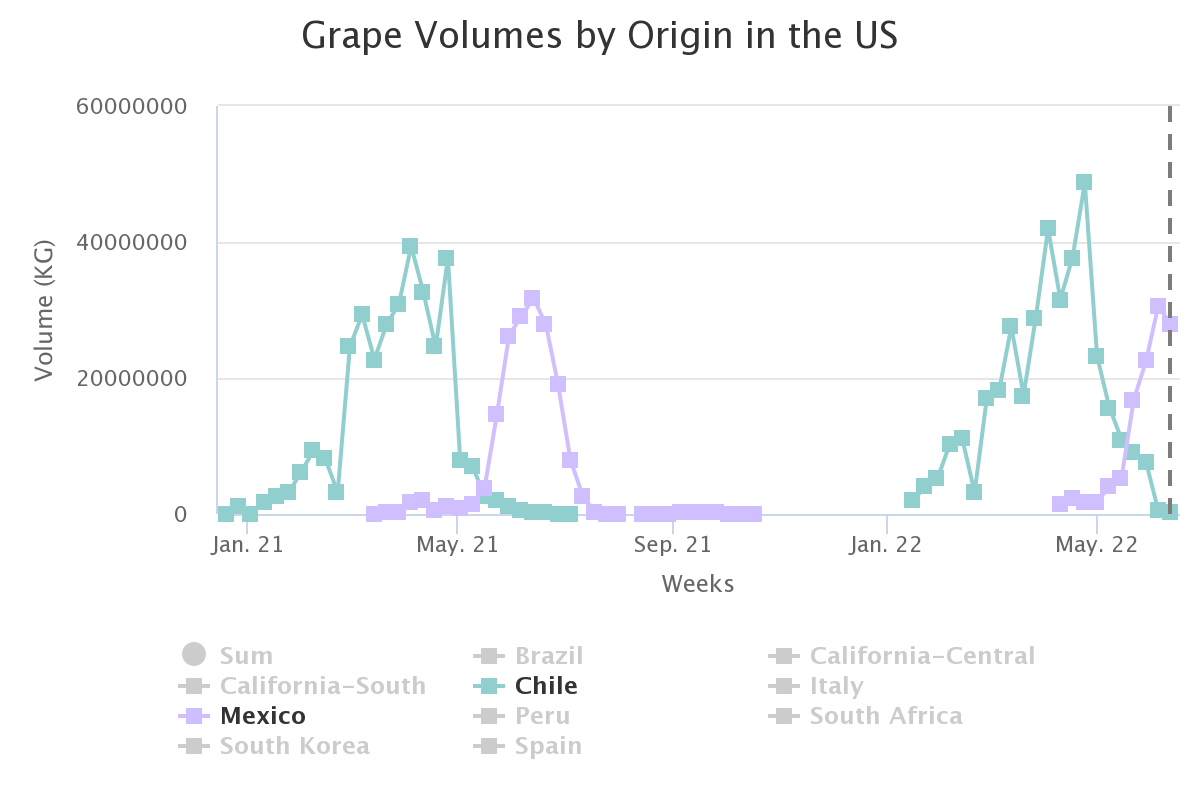
Source: USDA Market News via Agronometrics.
(Agronometrics users can view this chart with live updates here)
The Sonoran grape volumes in May were also affected by the general supply-chain issues by a large presence of Chilean grapes in the USA & Canada, as well as an active market in Mexico, sending more product to Mexico. The challenges of a tight labor market also contributed to tough decisions on production and markets. After the Memorial Day weekend, Chilean grape supplies began to subside, USA and Canada retail demand increased, while the Mexico market stabilized.
Source: USDA Market News via Agronometrics.
(Agronometrics users can view this chart with live updates here)
At this time, AALPUM has reconsidered its March 2022 estimate of 25 million boxes and believes it is reasonable to expect a very similar total volume to 2021 which was 21.3 million boxes.
The grape growers of Sonora are committed, as always, to provide the best quality fruit to our markets, and we work continuously to achieve this. Shipping will continue from Nogales and other forward distribution points until mid-July.
Finally, the Sonoran grape growers wish to thank each, and every person involved in getting the grape crop from the vineyards of Sonora to the consumers of the world.
The News in Charts is a collection of stories from the industry complemented by charts from Agronometrics to help better tell their story.
Access the original article with this (Link)
Related Stories