
Heavy supplies of avocados could put demand to the test
From
| 25 June 2020
Overview of the avocado supplies in the U.S. market, complemented by charts from Agronometrics. Original published on June 25, 2020.
Supplies of avocados in North America are ample to say the least.
“We have supplies coming from three different countries of origin right now. This is a perfect scenario for retailers right now because they can choose from any country of origin,” says Keith Slattery of Stonehill Produce Inc. in Capistrano Beach, CA.
California: California has a significantly larger avocado crop in 2020 compared to 2019. “California has 369 million lbs. of avocados and we’ve harvested 205 million. So, we’re 55 percent through with 45 percent remaining as of the middle of June,” says Slattery. “We expect California to continue harvesting at approximately 15 Million lbs per week through July and gradually tapering off thereafter with supplies through September.”
Volumes (in LB) of avocados from California in the US market
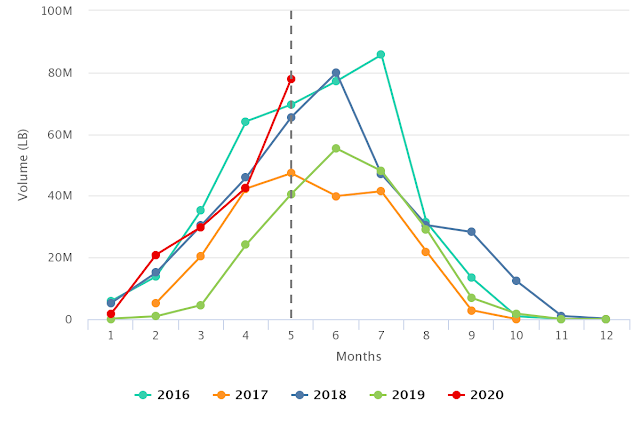
Source: USDA Market News via Agronometrics.
(Agronometrics users can view this chart with live updates here)
Peru: Peru, who’s just begun shipping, is also coming on strong with an ample crop. “Last week’s estimate was 15.8 million lbs. We will stay between 15-18 million lbs. all the way through to the second week of August and then it will start to decline,” says Slattery.
Peruvian growers had more of an opportunity to secure programs this year. Despite an ample crop in Mexico where growers effectively held back on supply to support prices, this allowed Peru to come in and get a lot of commitment from retailers. “We are seeing retailers this year advertising Peruvian fruit who in the past would never have even considered taking Peruvian fruit and putting them on ads,” says Slattery. He adds that retailers welcomed the chance to lock in pricing on the fruit and were also not concerned about supply this year given all three countries have a historically large crop of avocados.
Volumes (in LB) of avocados from Peru in the US market
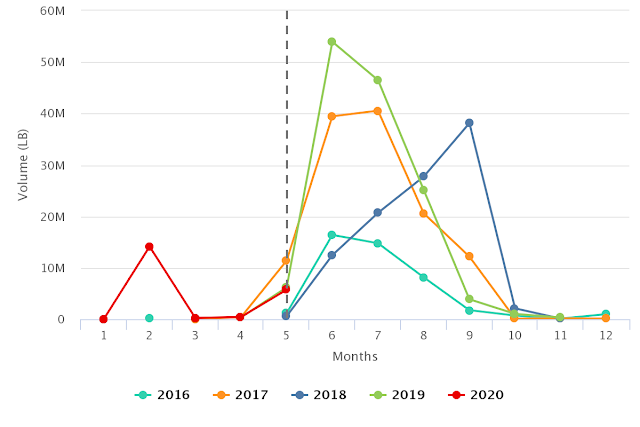
Source: USDA Market News via Agronometrics.
(Agronometrics users can view this chart with live updates here)
Mexico: “Mexico’s crop was so big last year that this is the first year I don’t think they’ll be able to get everything off the trees. Right now, Mexico has 200 million lbs. to harvest with one week left in the season,” he says. “It generally sends 85 percent of that to the U.S. If Mexico ships the same this week as they did last week, it’s still left with 134,000 million lbs. on the trees. The question is where will Mexico go with that fruit?”
He adds that the avocados harvesting now are late-season fruit. “Some can be dark, and they are mature and have high oil content. They eat fantastic but require special handing. Also, we have the added pressure of higher field temperatures and the rainy season which tend to trigger fruit drop from the trees,” says Slattery.
Volumes (in LB) of avocados from Mexico in the US market
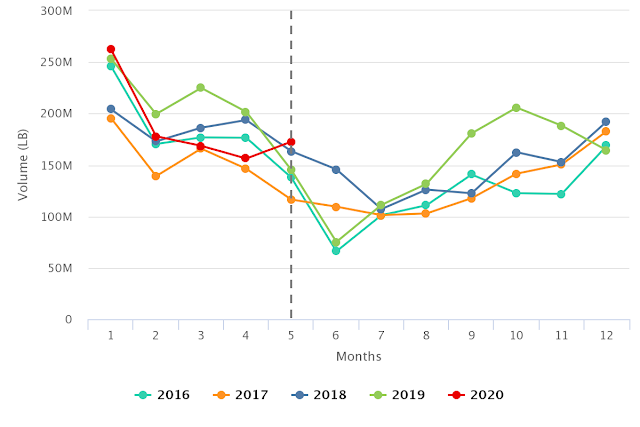
Source: USDA Market News via Agronometrics.
(Agronometrics users can view this chart with live updates here)
Strong demand too
As for demand, currently movement sits at about 50 million lbs. per week consistently. “When Covid-19 happened, the first four weeks, demand dropped from 50 million to closer to 40 million,” he says. After week four, demand moved back up to approximately 50 million a week which means that retail made up for the lack of foodservice demand. “I think foodservice demand is now probably back to 50 percent of what the demand was,” says Slattery.
All of this means in the face of abundant supply, prices have remained relatively stable for avocados. “Mexico has controlled the amount of fruit that they’ve sent into the U.S. which has helped support price stability.
However, looking ahead Slattery does note that with California and Peru firing on all cylinders and a stronger harvest imperative in Mexico, supply may exceed demand.
The News in Charts is a collection of stories from the industry complemented by charts from Agronometrics to help better tell their story.
Access the original article with this (Link)


