
Logistics influence mango movement and pricing
From
| 12 January 2022

Overview of mangoes in the U.S. market, complemented by charts from Agronometrics. Original published on January 10, 2022.
While there are steady supplies of mangoes, logistics are impacting movement and pricing on the fruit.
Mangoes in the US Market | Volumes (in Kg)
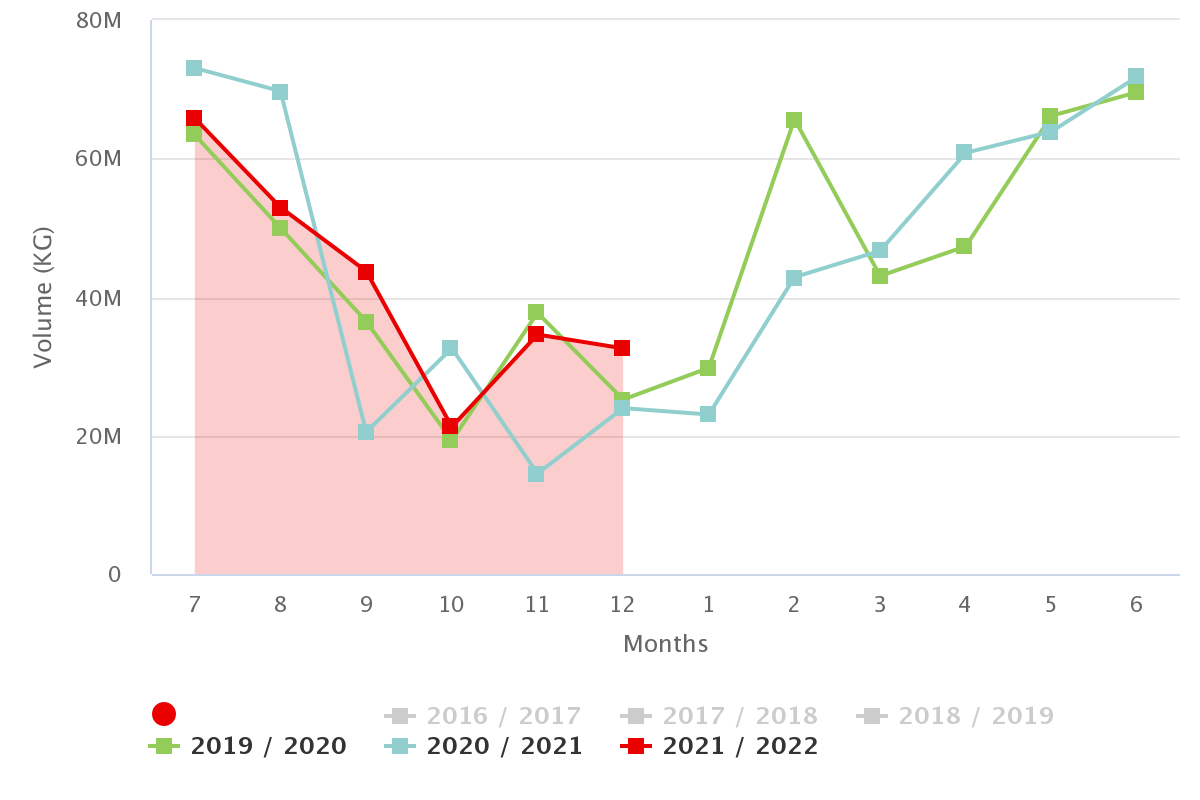
Source: USDA Market News via Agronometrics.
(Agronometrics users can view this chart with live updates here)
“Peru is very difficult this year. There’s a shortage of containers, a lack of space on the vessels and of course escalating costs,” says Nagelberg. “The resurgence of COVID is not helping the situation either. Between the logistics companies, the dock workers and the labor shortage, it all has intensified the time to move released containers from vessel to warehouse.”
Peruvian sizing
Peru has been shipping fruit for a just over a month and it appears to be an average sized crop of almost entirely Kent variety. Fruit size is running normal to maybe down a size with no shortages on 10s and 12s says Nagelberg.
Mangoes from Peru in the US Market | Price reported (in USD), by size
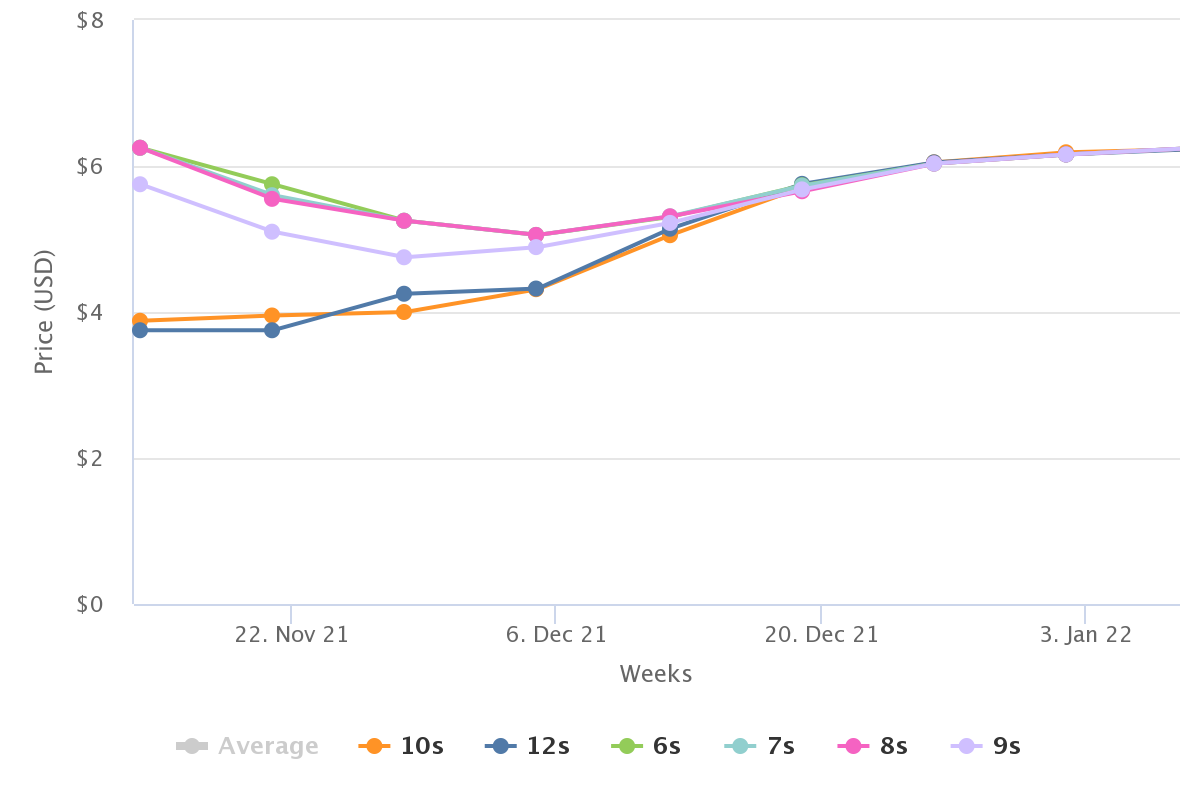
Source: USDA Market News via Agronometrics.
(Agronometrics users can view this chart with live updates here)
Coming up ahead is also Mexico, which will begin with early, limited supplies next month. “They will have an early district and then they’ll go to mostly early yellows, Ataulfos, for awhile. They’re not going to be a heavy player on the East Coast until sometime in later March,” says Nagelberg. At the same time, Peru will run until the end of March. “And once Peru ends production, we’ll begin to see production from Costa Rica, Guatemala and Nicaragua arriving on East Coast.”
Meanwhile Nagelberg says demand for mangoes is “just ok.” “However the contracts and the movement are good and keeping inventories low. If there was a normal demand right now, we believe the market would be higher than what it is,” he adds.
Mangoes supplies in the US Market | Volumes (in Kg)
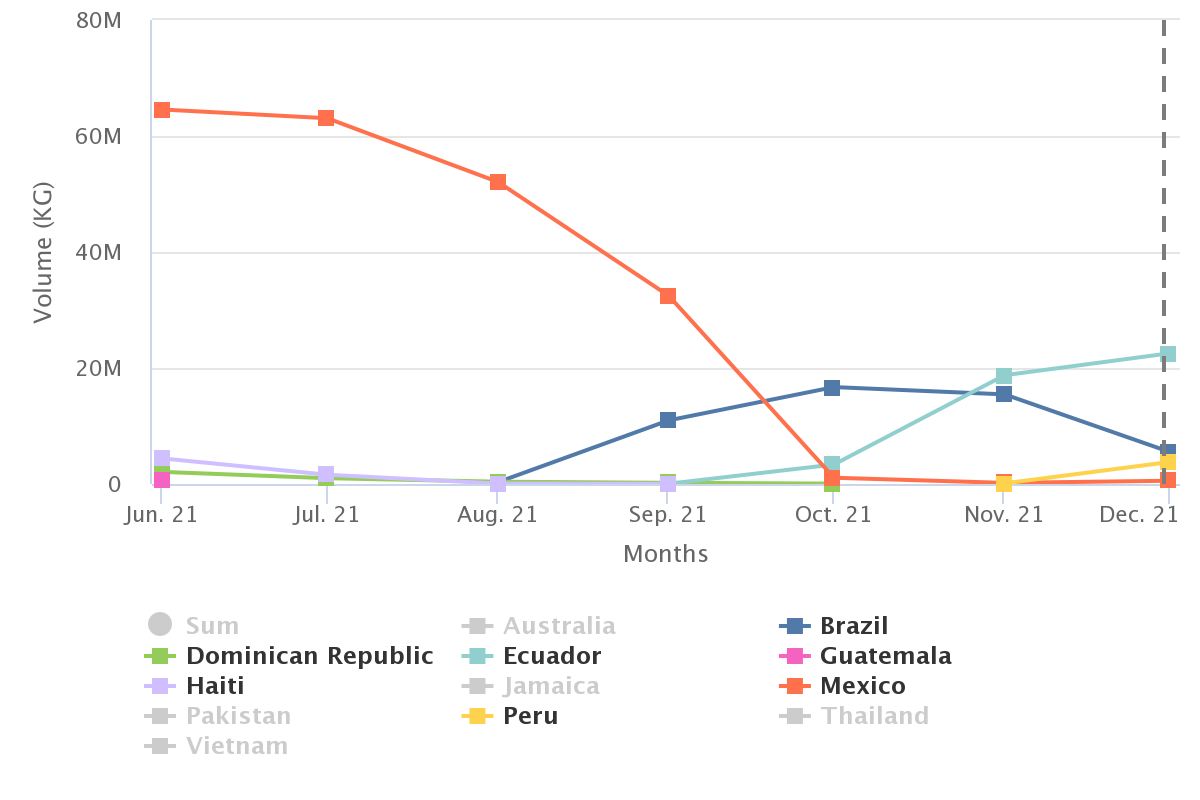
Source: USDA Market News via Agronometrics.
(Agronometrics users can view this chart with live updates here)
Pressures on pricing
He notes that pricing is similar to last year.
“It’s going to be interesting to see how this pans out. The supply side is not high and the demand side is not high. So with higher costs, are we going to be able to increase our price? That’s what we’re all looking for,” Nagelberg says. “All of our costs are higher from production to packing, container freight and extra charges such as port congestion. It all adds up. Then take the cost of moving fruit from the warehouse to destination. We all know freight rates are about double from normal, whatever normal is these days.”
Mangoes in the US Market | Price reported (in USD)

Source: USDA Market News via Agronometrics.
(Agronometrics users can view this chart with live updates here)
The News in Charts is a collection of stories from the industry complemented by charts from Agronometrics to help better tell their story.
Access the original article with this (Link)


