
New Feature Added to Agronometrics Data Tool to Visualize Yearly Data
By
| 18 April 2022
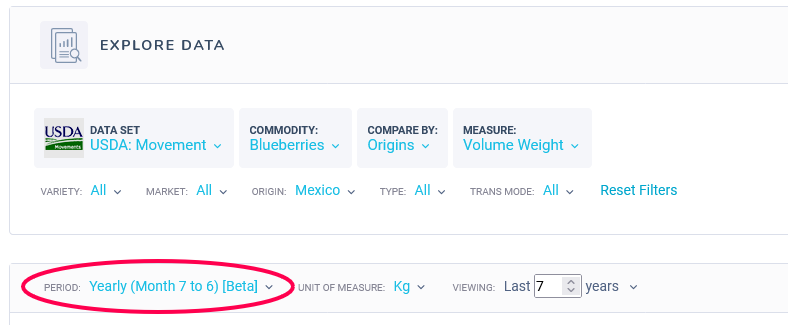
A new feature has been added to the Agronometrics data tool that provides users the flexibility to visualize data based on the seasonality of a particular commodity. Now you can explore data from the USDA Movement and Shipping Point Datasets calculating years from July to June of the following year allowing for calculations to cross over the new year and form a more complete view of seasonal growth for counter cyclical producers. Be it blueberries from Mexico or strawberries from Florida, our users will now have the additional flexibility to filter data in a way that suits their needs.
A case in point: When looking at blueberries from Mexico one of the challenges has always been capturing yearly growth trends given that the season extends throughout the year. With its lowest point in the northern hemisphere’s traditional summer months, as can be observed in the chart below.
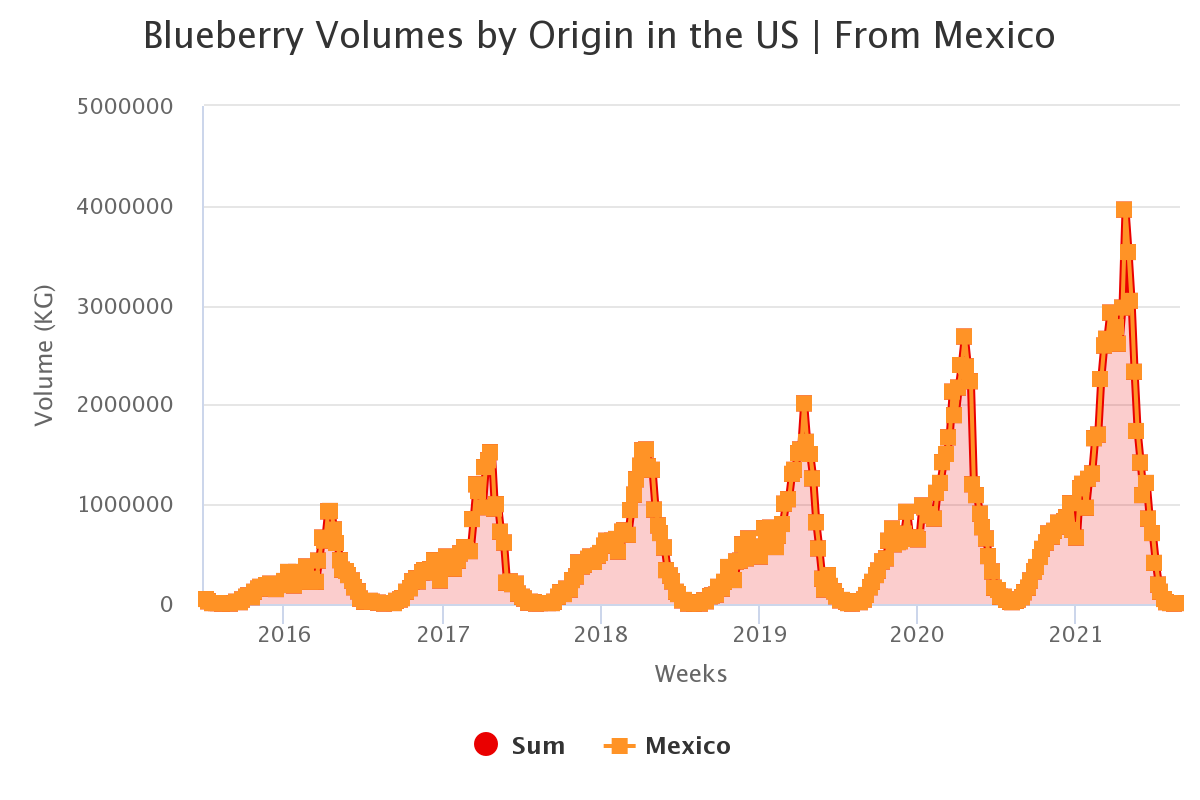
Source: USDA Market News via Agronometrics.
(Agronometrics users can view this chart with live updates here)
To capture this yearly growth the period can now be set as Yearly (Months 7 to 6) to obtain the chart displayed in the second figure.
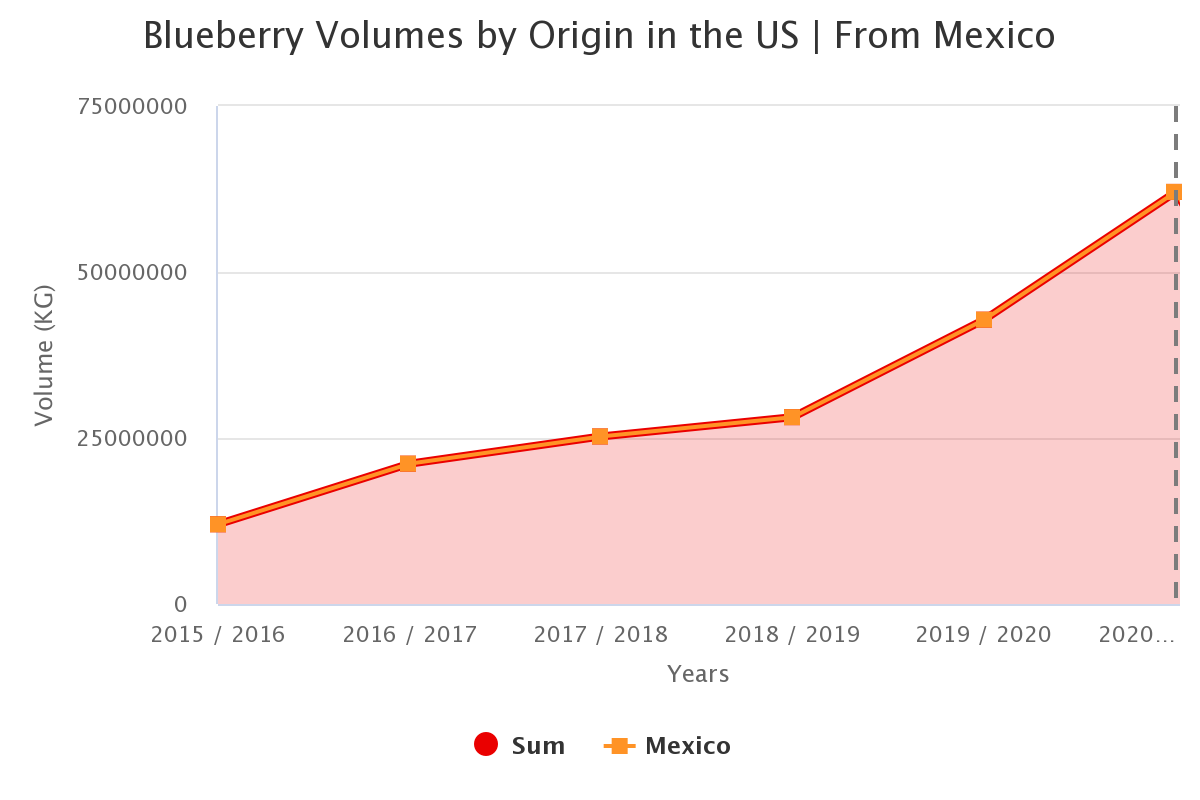
Source: USDA Market News via Agronometrics.
(Agronometrics users can view this chart with live updates here)
Written by: Sarah Ilyas


