Apples
Asparagus
Avocados
Blackberries
Blueberries
Cherries
Clementines
Fruits
Grapes
Kiwifruit
Lemons
Limes
Mangos
Nectarines
Oranges
Peaches
Pears
Plums
Raspberries
Strawberries
Price Alerts! are here for all
By
| 19 August 2019
As we bring price alerts to Agronometrics we thought we would pen a piece on our thinking behind the service as well as the methodology for it.
The idea for the Alerts arose from our conversations with the industry, where several people expressed high interest in knowing when there are important changes in the market prices that could affect their business.
This impetus created the Price Alerts! service, whereby we monitor daily average prices of every commodity on our platform, so that you don’t have to. As soon as the difference in price reaches a certain threshold you get an email alerting you of said price change. You can take a look at our sample report through this link (US Avocado Price Alert!)
In order not overflow our users with these email alerts, we have used some fancy statistical analysis and determined the required values so as to send some 12 alerts per year for each commodity. In the table below you will find the list of commodities along with their estimated limits that would trigger and result in a Price Alert! email notifying you of a significant price change.
The last column on the chart is a link that Agronometrics users can use to look at the reports that create the alerts. Although these reports are not ideal for everybody, they are the best we have found so far to summarize each of the commodities we work with.
Price Alert! Trigger Limits by Commodity (Non-Organic)
Price Alerts! Methodology
For the nerdier fresh produce market observes, below we offer a technical look at how these limits are calculated. To help demonstrate our methodology, we can look at the last six months of Non-Organic Avocado prices, which, of all the categories we track, has been the most volatile.
This chart shows the daily average price calculated by Agronometrics, with prices ranging from $23.75 on the 15th of February 2019, to a peak of $72.51 on the 16th of July 2019. During that time the market has been littered with massive price swings from one day to the next, which provide useful intelligence to market observers.
USDA Avocado Non-Organic Prices
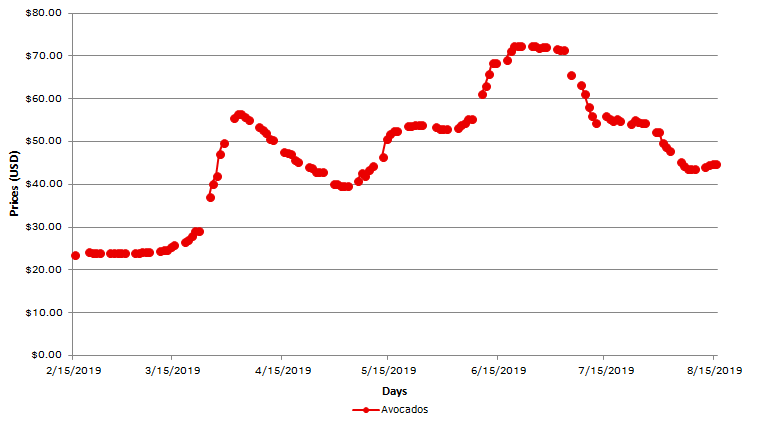
(Source: USDA Market News via Agronometrics)
[Agronometrics users can view this chart with live updates here]
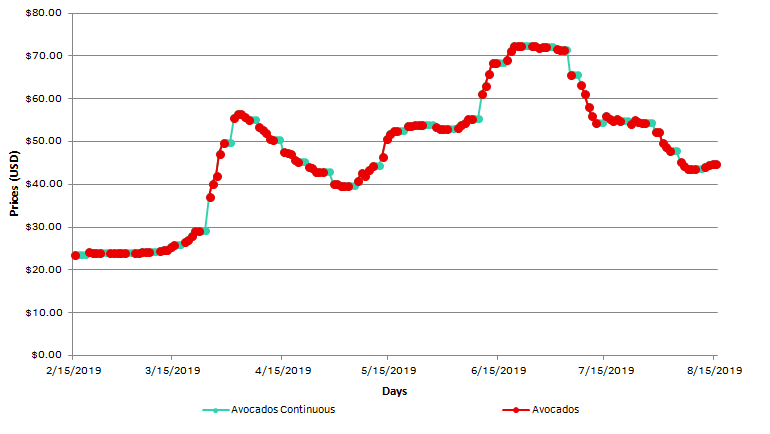
(Source: USDA Market News via Agronometrics)
[Agronometrics users can view this chart with live updates here]
Because the pricing data is not strictly continuous and is broken up by weekends, holidays, or unavailability of fruit on the market, it is necessary to fill in such gaps. This is done by simply using the last price calculated. This means that if there is a big difference between the last price reported on Friday and the newest price on Monday, the Price Alert! will be generated and sent on said Monday. A similar process is performed for any sort of extended time period where pricing is unavailable. The chart below demonstrates what the same data looks like with the gaps filled in.
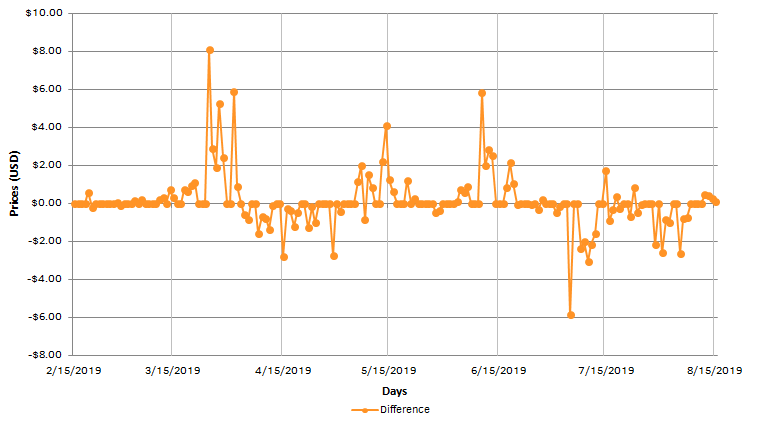
The next step in the process helps us visualize the changes in each price observed. The calculation is straighforward, simply subtracting the last price reported by the previous price reported. The chart below shows us what the difference in prices looks like for the time period we are observing. These peaks and dips are the raw material for Price Alerts!
Because prices change almost every day and we don’t want to flood email boxes, we have to establish a limit that only informs us of significant price swings and lets the rest carry on without bothering us. To accomplish this across every commodity we track, for the five years of daily history we used as our test population, we relay on a basic statistical tool called a Standard Deviation. This tool allows us to describe the distribution of a population of values by measuring the distance from average that encompasses an expected percentage of the observations.
This isn’t an arithmetic lesson, so we won’t go step-by-step into how to make the calculation and the transformation we used to determine the final cut off, but rather our focus is the interpretation of its results. The chart below shows what the distribution of the difference in price looks like. The average for the dataset we looked at is $0.0147 with a standard deviation of $1.09. The numbers at the bottom are the standard deviations represented by the symbol σ. So this means that 1σ is amount of changes in price that we have measured in the last five years between the average plus one standard deviation, so between $0.0147 and $1.1047. -1σ is the number of changes in price that we have measured in the last five years between between average minus one standard deviation, or -1.0753. The same applies to the rest of the standard deviations in the chart.
In general +/- 1σ = 68.1% of the observations, +/- 2σ = 95.4% of the observations, +/- 3σ = 99.6% of the observations.
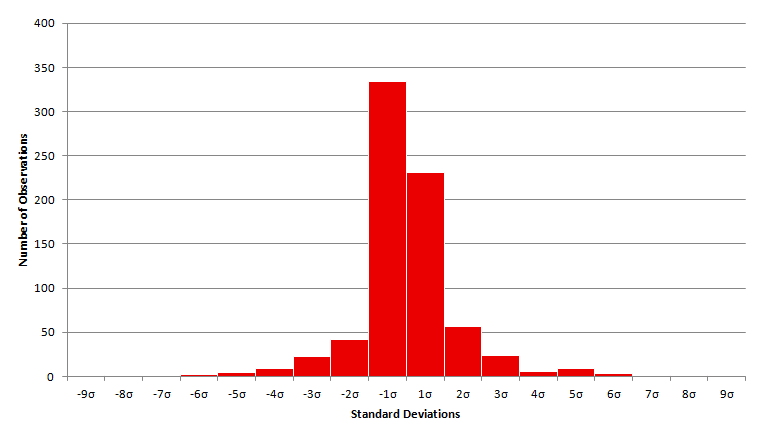
The values we calculated by themselves are interesting. The positive average price for the dataset tells us that over the last five years prices have increased, which already says a lot about the category and its projection. We can also see that -1σ is higher than 1σ. This is also really interesting because it tells us that when prices fall they do so in smaller increments, and when they rise they go up faster. This observation is reinforced with 2σ being larger than -2σ.
With this information at hand and a bit of proprietary secret sauce, we can calculate what the standard deviation has to be for us to gene
rate approximately 12 reports a year. Admittedly an arbitrarily chosen Goldilocks number that we trust is not too many email alerts, nor not too few, but rather results in sending on average one alert per month.
For Avocados, the standard deviation that would create 12 reports a year comes out to 2.3σ, giving us the lower limit of -$2.48 and the upper limit of $2.52. If we look again at the difference in daily prices over the last six months of avocado prices we can appreciate what these limits look like.
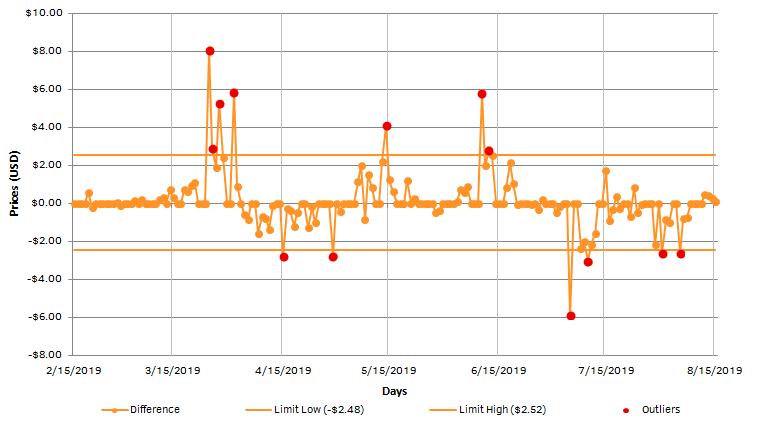
Following this methodology, our Price Alerts! system would have had created 13 emails in the last six months. Sending several between March and April indicating sharp rises in prices. Between April and May there were two alerts notifying of a fall in price, and between May and June there were three alerts notifying that prices were rising again. The rest of the reports after the 15th of June let us know that prices have been falling steadily. If we compare these results against the first chart of this article we can clearly see how the alerts follow the general trend of the prices quite remarkably.
As was stated earlier, the objective of this tool is to send 12 alerts a year, a measure that, in Avocados, we have already surpassed. This doesn’t mean that the system will stop working, but it does say that we are seeing greater volatility than in the last five years. If the prices jump or dip again above the established thresholds, then the service will send more alerts. Because markets are constantly changing and evolving, we will periodically revisit these calculations and adjust the values to ensure that our limits are relevant to the data and categories we work with.
We also strive to constantly improve our service and invite any comments, opinions and suggestions to the service and the methodology. And as always, feel free to write to us at info@agronometrics.com.
Written by: Colin Fain