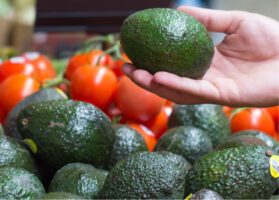
U.S. per-capital avocado consumption has tripled since 2001
From
| 30 March 2020

Overview of the U.S. avocado demand, complemented by charts from Agronometrics. Original published on March 27, 2020.
U.S. demand for avocados has increased steadily over the past two decades, according to recent data published by the USDA.
The organization said that per-capital consumption tripled since 2001 to 8 pounds per person in 2018.
The USDA also noted that U.S. avocado acreage has declined over time.
But, although avocado production has dropped since 2001, growing demand has benefited domestic producers through higher prices. For example, the price received by California growers in 2018 is up 22 percent from 2011.
Since avocados can mature on the tree for an extended period, U.S. growers look for opportunities when fruit quality is at its peak and market conditions are optimal to harvest and ship to domestic and export markets
In terms of imports, in 2007 Mexico overtook Chile as the dominant supplier, and by 2018 accounted for 89% of fresh avocado imports.
Volumes (in KG) of avocados in the US market from 2000 to 2020, by origin.
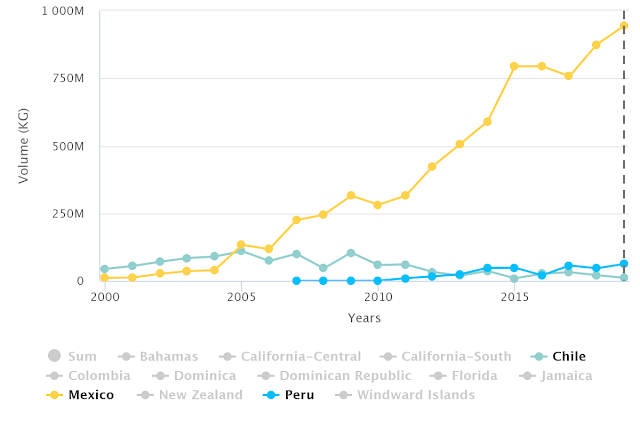
Source: USDA Market News via Agronometrics.
(Agronometrics users can view this chart with live updates here)
In 2018, Peru was the second-largest source of imports, and shipments increase during the summer, when Mexican imports are their lowest.
Volumes (in KG) of avocados from Peru and Chile in the US market, 2010 to 2020.
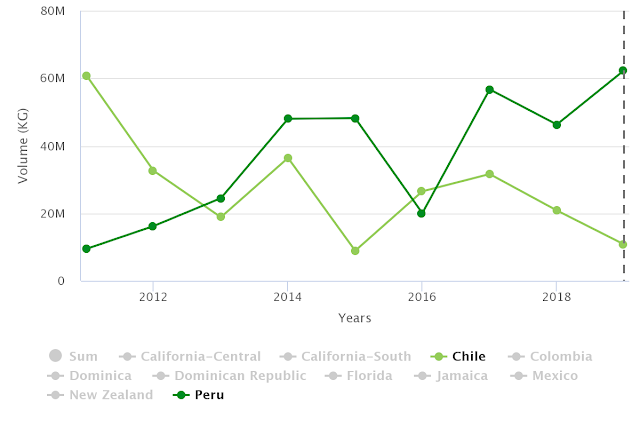
Source: USDA Market News via Agronometrics.
(Agronometrics users can view this chart with live updates here)
Sales rise at start of 2020
Meanwhile, the Hass Avocado Board noted this week that the first four weeks of 2020 saw an uptick in avocado retail sales in the U.S. Sales grew by 1.3% year-on-year to 193m united.
The Southeast region saw double-digit growth in retail volume, driven by four of the top five fastest-growing markets: Miami/Ft. Lauderdale (+19.3%), Tampa (+17.7%), Orlando (+17.3%) and Jacksonville (+14.6%).
Average selling price (ASP) declined in all regions except California, resulting in a Total U.S. ASP decline of -3.3%. This drop in ASP contributed to a -2.1% decrease in total U.S. dollar sales for the period.
The News in Charts is a collection of stories from the industry complemented by charts from Agronometrics to help better tell their story.
Access the original article with this (Link).
Related Stories