
Agronometrics in Charts: Colombian Avocados Stepping Forth
By
| 11 March 2022

In this installment of the ‘Agronometrics In Charts’ series, Sarah Ilyas analyzes the development of the avocado market in Colombia. Each week the series looks at a different horticultural commodity, focusing on a specific origin or topic visualizing the market factors that are driving change.
Colombia’s agricultural exports increased by 19.9% over the course of the previous year, allowing the country to move up a spot in ranking and enabling it to peg itself as the world’s sixth largest supplier of avocados. The country is emerging as Peru’s direct competitor on the world stage for avocados. According to Portual Portuario, Colombian avocado shipments totaled 96,903 tons in 2021, displaying an increase of 26 percent in volume in comparison to the previous year. In 2022, Colombia aims to increase its export volume 30% by focusing on product quality. Their plan would allow the country to boost exports to the United States and by 40% in 2023 and by 50% by the end of 2024, says Jorge Enrique Restrepo, the executive director of Colombia’s Hass Avocado Producers and Exporters Corporation (Corpohass). “We currently have 262 properties with 7,918 hectares authorized to export. In addition, there are 313 properties under surveillance with 9,236 hectares; so the great challenge is getting more properties authorized to export to the United States, and getting exporters to trust and bet on this market in the long term,” he added. The primary season for avocados in Colombia is known as ‘in-season’ and harvest takes place between October and March, representing two-thirds of the total harvest. The secondary season known as ‘off-bloom’ runs from May – August and represents the remaining portion of the crop. As shown below, this season saw a peak volume of 539 K kgs flowing in during week 7, a significant mark up compared to the previous season.
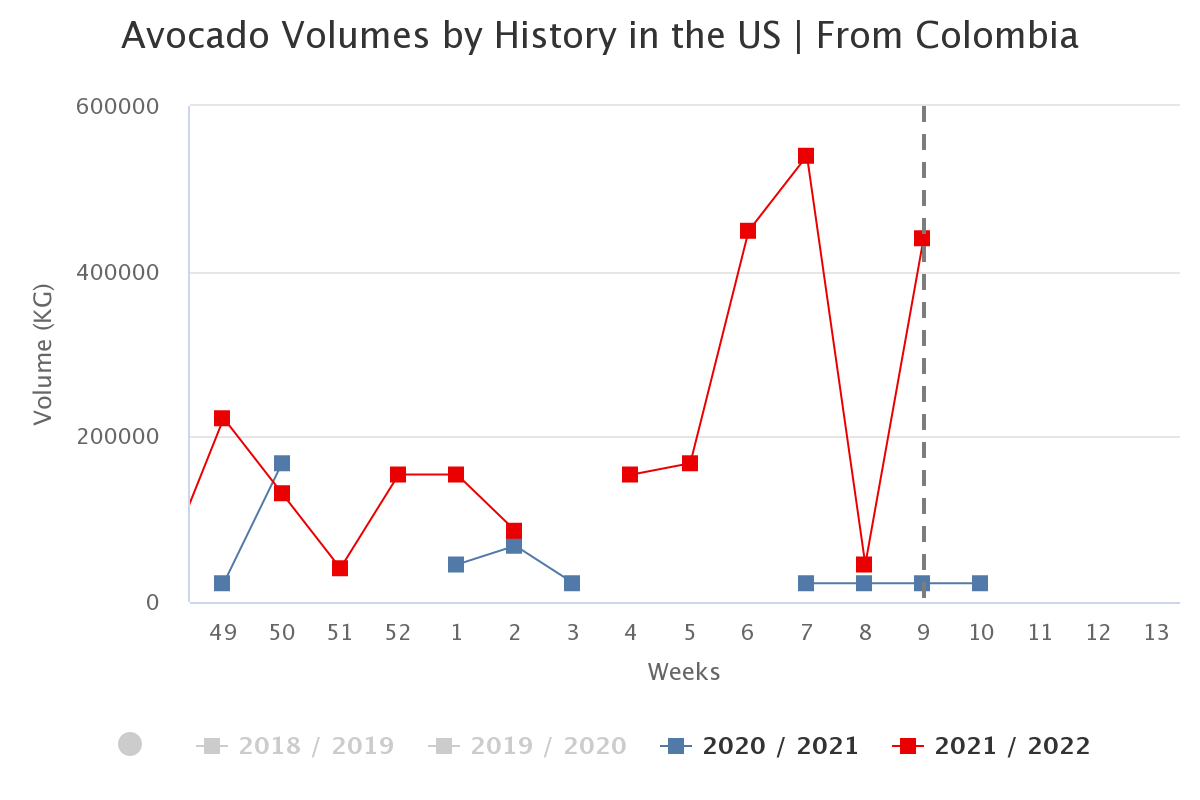
Source: USDA Market News via Agronometrics.
(Agronometrics users can view this chart with live updates here)
In November, The Colombia Avocado Board revealed a strategic plan to increase Colombian avocado imports to the U.S by debuting a new brand called Colombia Avocados. The initiative was focused on building B2B relationships with U.S. buyers and sharing information about Colombia avocados to underscore their inherent value.
The Philadelphia-Camden area is the main market for Colombian avocados, followed by Los Angeles, Houston and Pt Canaveral in Florida. This season witnessed a total volume of 471 K kgs being exported to the Philadelphia-Camden area.
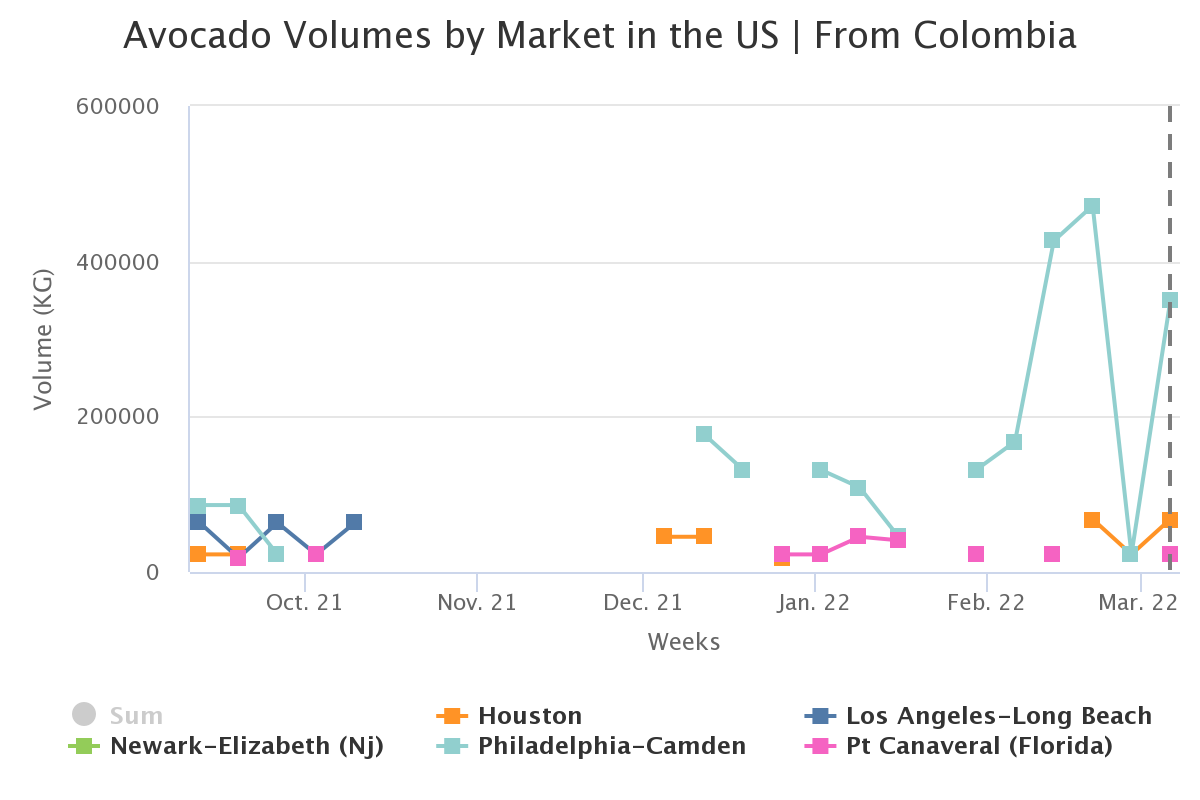
Source: USDA Market News via Agronometrics.
(Agronometrics users can view this chart with live updates here)
The development of Colombian avocado production indicates an important source of growth for the countries agriculture since it leads to the generation of employment in rural areas and provides stimulus for development across different regions and sectors of the country. There has been a collective effort to implement plans for regions free of quarantine pests that open up channels for access to foreign markets. This constitutes a strategic proposal made up of strategies and a coherent set of objectives which, based on a clairvoyant vision of the future, seek to double the area of production in Colombia.
In our ‘In Charts’ series, we work to tell some of the stories that are moving the industry. Feel free to take a look at the other articles by clicking here.
All pricing for domestic US produce represents the spot market at Shipping Point (i.e. packing house/climate controlled warehouse, etc.). For imported fruit, the pricing data represents the spot market at Port of Entry.
You can keep track of the markets daily through Agronometrics, a data visualization tool built to help the industry make sense of the huge amounts of data that professionals need to access to make informed decisions. If you found the information and the charts from this article useful, feel free to visit us at www.agronometrics.com where you can easily access these same graphs, or explore the other 21 commodities we currently track.
Written by: Sarah Ilyas


