
Blueberries in Charts: How does Peru’s expected big increase play into its export strategy?
By
| 24 September 2019

Peru’s blueberry exporters this season expect to ship between 100,000 metric tons (MT) and 110,000MT, according to Roberto Vargas, president of ProArandanos. Even if we just take the lower end of what is expected, this would mean a 28% increase over last year’s 78,000MT.
This volume by no means makes Peru the largest producer in the world. But the rate of growth the origin has experienced is the fastest the world has ever seen.
Even if we just look at the imports to the U.S., we can clearly see how Peruvian producers have gone from sending symbolic volumes five years ago to becoming a major player – and the largest supplier during the height of their production window.
Non-Organic Blueberry Volumes from Peru
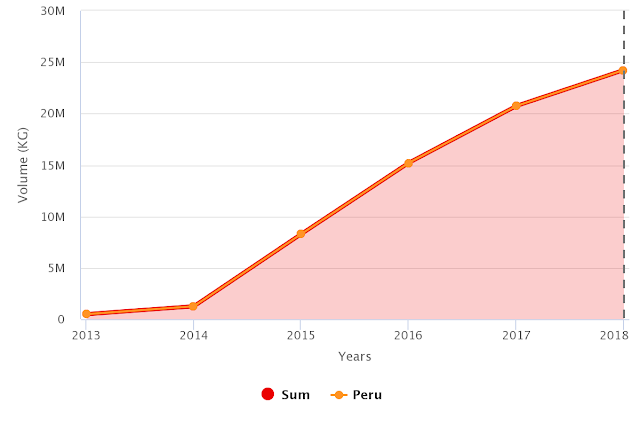
Source: USDA Market News via Agronometrics. (Agronometrics users can
view this chart with live updates here)
As the 2019-20 season gets underway, Peru has already sent an impressive volume to the U.S.; exports have risen seven-fold from 213MT to 1,400MT.
This increase in volume is indicative not only of Peru’s increase in production but also – I believe -of the strategic management of its season. The country has been continually pushing its exports forward to center its production in September, October and November. In the U.S., those months fall between Canada and Chile and have historically been the hardest to supply.
Historic Non-Organic Blueberry Volumes from Peru
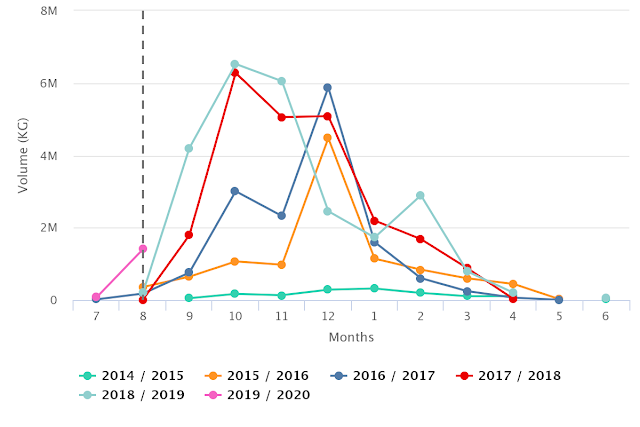
Source: USDA Market News via Agronometrics. (Agronometrics users can
view this chart with live updates here)
When it comes to how Peru’s fruit is being received by importers, all the signs are very encouraging. This is possibly a nod to the quality of fruit the origin is producing, while other origins are winding down.
In per-kilo terms, Peruvian fruit has fetched the highest prices in the market for the last three weeks running; they achieved a $2.67 per kilo premium over Washington and Oregon, its nearest competitors.
Non-Organic Blueberry Prices per Kilo by Origin
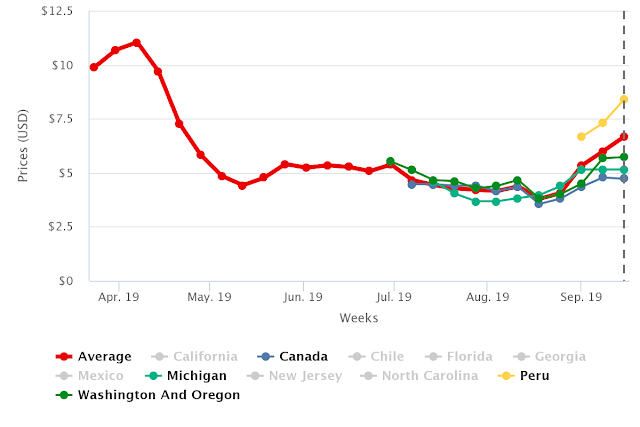
Source: USDA Market News via Agronometrics. (Agronometrics users can
view this chart with live updates here)
Written by: Colin Fain
Original published in FreshFruitPortal.com on September 24, 2019 (Link)


