
Clementines in Charts – It’s almost ClemenTime for Chile
By
| 16 April 2019
Clementines are among the author’s favorite Spring fruits because they check all the boxes: a goldilocks size (not too large, not too small), easy to carry, easier to peel -its segments pull out with more ease than Legos- all whilst providing a very pleasing sweet flavor without the high acidity that often accompanies citrus. And as a bonus: because it’s a hybrid, if cultivated properly it grows with no seeds. The name Clementine comes from the 19th century French missionary named Marie-Clément Rodierem, who is believed to be the first origin for this hybrid citrus while working at an orphanage in Algeria.
Today, and when we give a bird’s eye view at shipments to-and-within the US Market, we observe how Clementines experience a two-peaks-two valleys type of landscape in any given year.
Clementines, Non-Organic, Monthly Shipments for previous 4 years
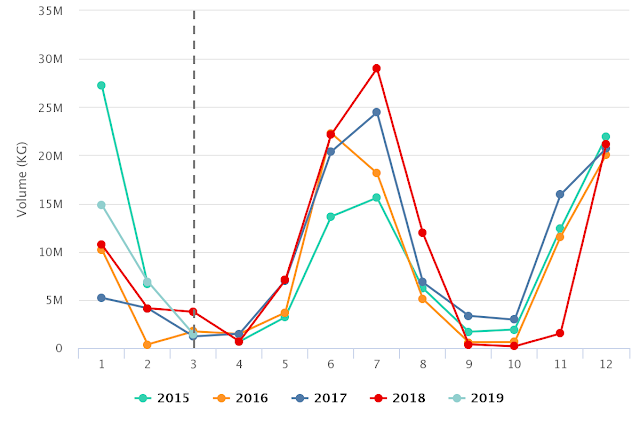
(Source: USDA Market News via Agronometrics)
[Agronometrics users can view this chart with live updates here]
Whatismore, April is one of the three months with the least amount of Clementines’ movement (with September & October being the other two). Thus, in the present month we find ourselves on the low-point created by the end of the Morrocan season and the very beginning of Chile’s. These two countries are incidentally, the two main sources,providing an outstanding 27% and 55% of the total fruit on the market in 2018, respectively.
Table 1, Clementines, Non Organic, Annual US Shipments
| Year | Global Volume (KG) | Global Share | Chile Volume (KG) | Chile Share | Morocco Volume (KG) | Morocco Share |
| 2014 | 134,850,744 | 100.0% | 24,653,160 | 18.3% | 41,726,664 | 30.9% |
| 2015 | 111,132,000 | 100.0% | 30,327,696 | 27.3% | 43,423,128 | 39.1% |
| 2016 | 95,823,000 | 100.0% | 42,012,432 | 43.8% | 20,026,440 | 20.9% |
| 2017 | 113,576,904 | 100.0% | 38,029,824 | 33.5% | 22,371,552 | 19.7% |
| 2018 | 112,665,168 | 100.0% | 61,948,152 | 55.0% | 29,860,488 | 26.5% |
| YDT | 23,178,960 | 100.0% | 0 | 0.0% | 20,529,936 | 88.6% |
Here’s a closer look of the aforementioned period during 2018, where we identify Morocco’s last shipment on the week of 8-APR and Chile’s first shipment on the week of 29-APR.
Clementines, Non-Organic, Weekly Shipments Spring 2018
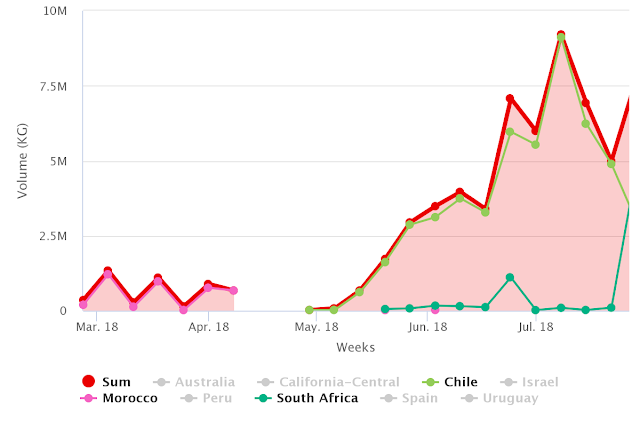
(Source: USDA Market News via Agronometrics)
[Agronometrics users can view this chart with live updates here]
So with current the gap in supply, and the expected arrival of significant volumes from Chile -as well as potentially Peru as detailed in a recent FreshFruitPortal.com article: Peru expecting 8% uptick in citrus exports– it is only wise to review Clementines’ price behaviours to help us better anticipate upcoming price trends.
Clementines, Non-Organic, Historic Weekly Prices per KG
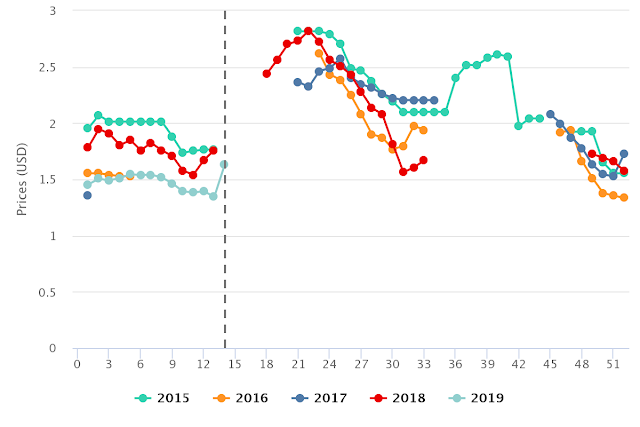
(Source: USDA Market News via Agronometrics)
[Agronometrics users can view this chart with live updates here]
A glance at historical price trends, shows we could very well expect prices to start off around-or-above USD $2.50/KG levels sometime over the next two weeks and stay in that neighborhood until mid-June (weeks 24 & 25) after which, a steady price drop is to follow until the Southern Hemisphere’s season ends around late August.
And yet, If we step further back and look at the even bigger picture, we can see that US Annual Sales for Clementines are stagnating, if not slightly decreasing. The assumption is that Chile’s skyrocketing production (go back and have another look at the Table 1: 24M KG. in 2014, 42M KG in 2016, 61M KG in 2018) could be driving average selling prices down.
Table 2, Clementines, Non Organic, Estimated Annual Sales
| Year | Est SALES (in USD) | AVERAGE ANNUAL PRICE per KG |
| 2014 | $323,641,786 | 2.40 |
| 2015 | $245,601,720 | 2.21 |
| 2016 | $177,272,550 | 1.85 |
| 2017 | $232,832,653 | 2.05 |
| 2018 | $221,950,381 | 1.97 |
Notwithstanding the subtle downward tendency of annual prices for Clementines in the US market, and thanks to reversed Seasons, Chile and Peru still benefit from higher prices than Morocco & Spain; which fall in the (USD/KG) $1.30 to $1.90 range.
Thus, with its soaring annual production and US prices partly lagging, it is now wonder that Chile’s industry is seeking to conquer new markets, particularly in East Asia and Latin America.
Written by: Luis Aragon
Original published in FreshFruitPortal.com on April 16, 2019 (Link)


