
Grapes in Charts: Will lower volumes be enough to bring market back to “normal”?
By
| 20 August 2019

In the last couple of weeks, the U.S. grape market has jumped up considerably from its lowest points which were around week 27 – coincidentally the week our last Grapes in Charts article was published. As we continue to track the commodity through the shift from Mexico to California, we can appreciate how the trend is close to the pricing we were seeing last year.
Historic U.S. market grape prices per case
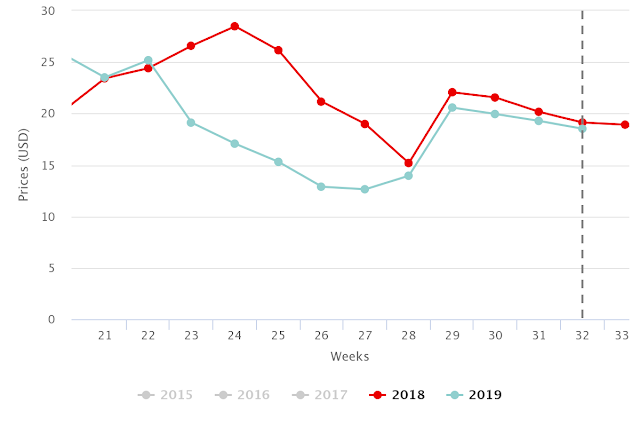
Source: USDA Market News via Agronometrics. (Agronometrics users can
view this chart with live updates here)
The fact that prices jumped up are not a surprise to many industry observers; volumes more than justify what we are seeing.
Historic U.S. market grape volumes
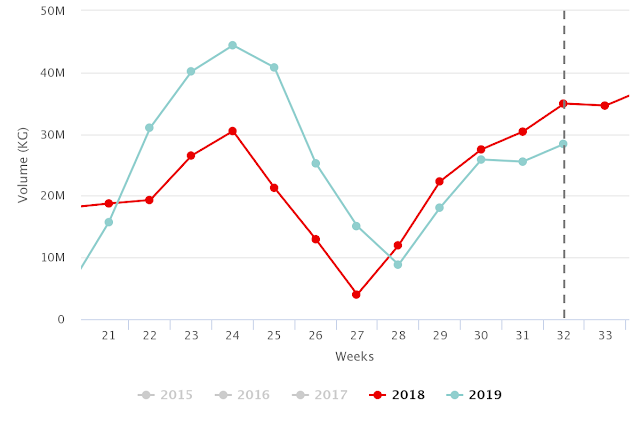
Source: USDA Market News via Agronometrics. (Agronometrics users can
view this chart with live updates here)
California previously said it is expecting less volume – a promise it has so far delivered on. As the season evolves, it will be interesting to see how far off of last year’s bumper crop California will end up sending and conversely how the prices will react to it.
If volumes end up being too close to last year, the pricing situation could a difficult one. If volumes are closer to 2017-18, pricing should return to normal levels for the rest of the season. However, this scenario would require a much more dramatic drop in volume than the industry has so far predicted; it would have to be in the neighborhood of 15% lower than last year’s volume.
Historic U.S. market California grape volumes
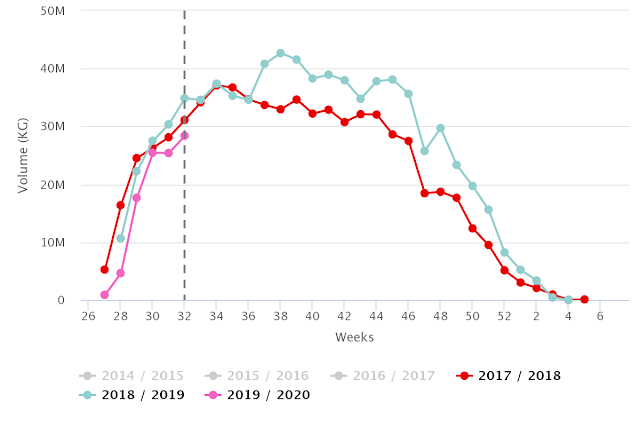
Source: USDA Market News via Agronometrics. (Agronometrics users can
view this chart with live updates here)
Written by: Colin Fain
Original published in FreshFruitPortal.com on August 20, 2019 (Link)


