Imports of organic produce surge
From
| 18 January 2022

Overview of organic fresh produce imports in the U.S. market, complemented by charts from Agronometrics. Original published on January 14, 2022.
U.S. organic fresh produce imports are surging, according to USDA import statistics.
Mexico is a leading source of imported organic produce, according to the USDA, and top organic produce imports tracked by the agency include avocados, blueberries, greenhouse peppers, bananas and mangoes.
Value of U.S. imports of Mexican produce, for the December 2020 through November 2021 period, were:
- Avocados: $171.4 million, up 44% from 2020 and 2019;
- Blueberries: $138.7 million, up 40% from 2020 and up 133% from 2019;
- Greenhouse peppers: $85.2 million, up 18% from 2020 and up 31% from 2019;
- Bananas: $84.4 million, up 5% from 2020 and up 44% from 2019;
- Mangoes (September through May): $22.8 million, up 51% from 2020 and up 96% from 2019;
- Mangoes (June through August): $22.8 million, up 60% from 2020 and up 180% from 2019;
- Squash: $20.2 million, down 17% from 2020 and up 3% from 2019;
- Bell peppers (field): $18.5 million, up 64% from 2020 and up 186% from 2019;
- Raspberries: $15.9 million, no comparison available;
- Strawberries: $9.78 million, no comparison available; and
- Blackberries: $8.55 million, no comparison available.
Organic fruits from Mexico in the U.S. market | Historical volumes (in Kg)
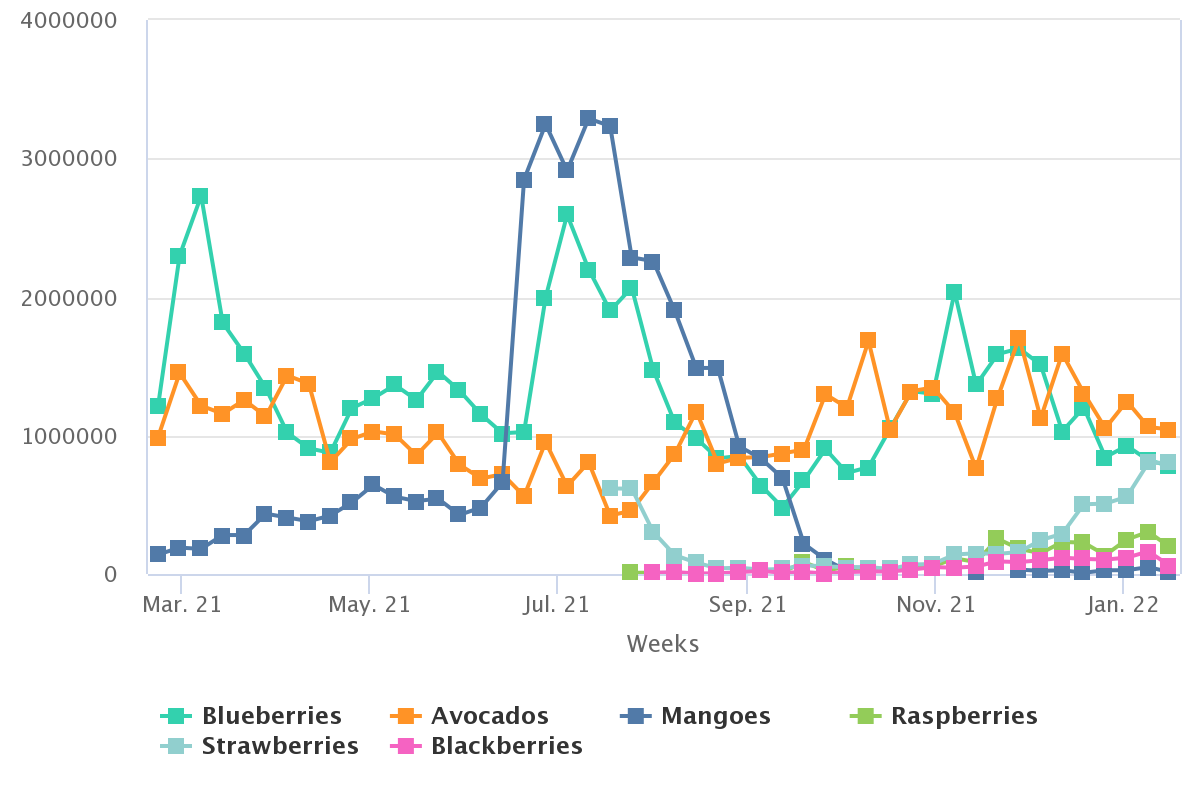
Source: USDA Market News via Agronometrics.
(Agronometrics users can view this chart with live updates here)
U.S. imports of Peruvian organic produce are increasing fast, according to USDA statistics
Value of U.S. imports of Peruvian produce for the December 2020 through November 2021 period, were:
- Blueberries: $134.1 million, up 125% from 2020 and up 185% from 2019;
- Bananas: $40.8 million, up 4% from 2020 and down 4% from 2019;
- Ginger: $29.02 million, up 27% from 2020 and up 131%;
- Avocados: $15.9 million, down 4% from 2020 and down 7% from 2019; and
- Mangoes (September through May): $6.2 million, up 3% from 2020 and up 20% from 2019;
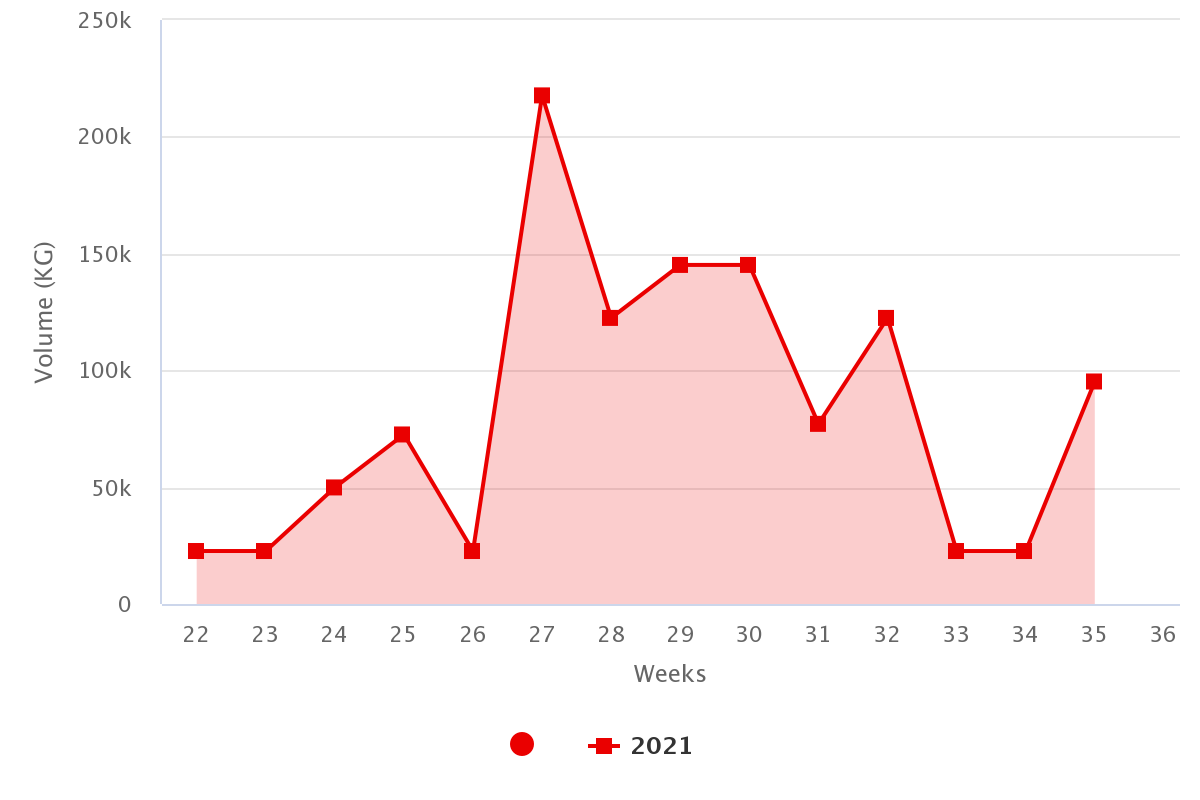
Organic fruits from Peru in the U.S. market | Historical volumes (in Kg)
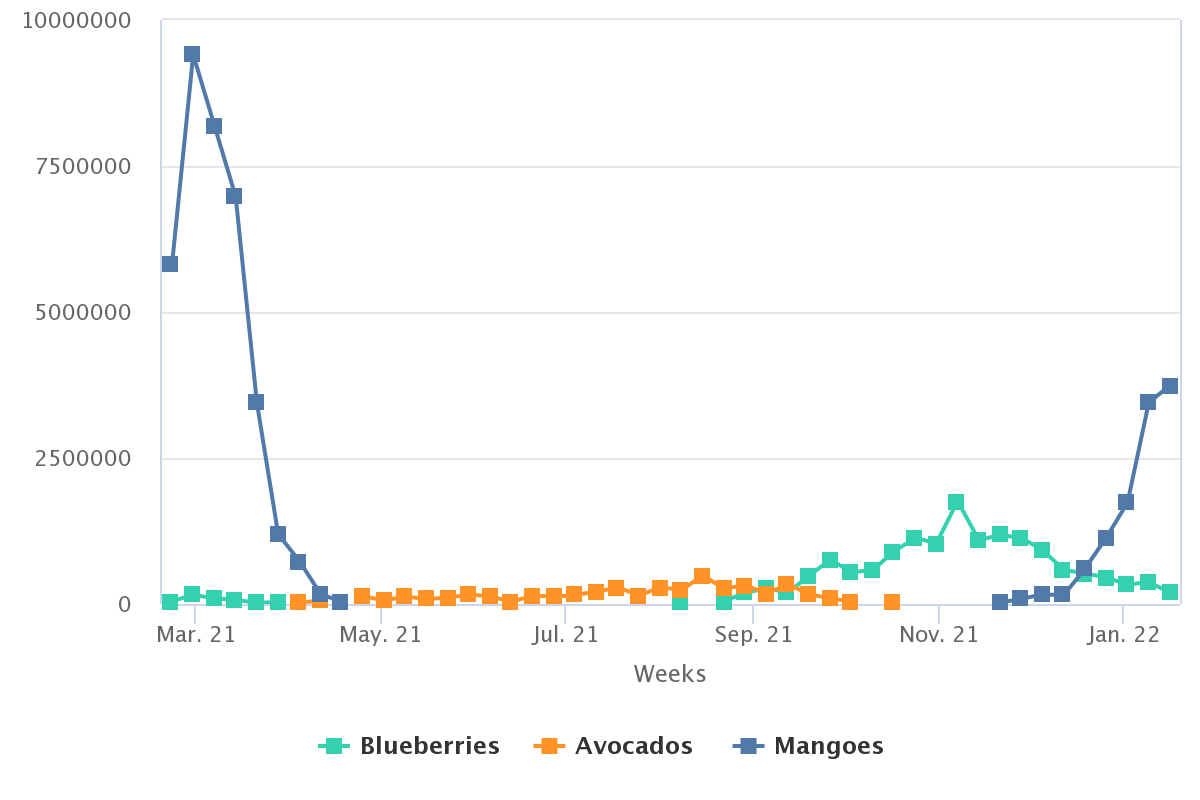
Source: USDA Market News via Agronometrics.
(Agronometrics users can view this chart with live updates here)
Ecuador is a leading supplier of organic bananas to the U.S. market.
Value of U.S. imports of Ecuador produce, for the December 2020 through November 2021 period, were:
- Bananas: $122.7 million, up 4% from 2020 and down 4% from 2019; and
- Mangoes: $2.5 million, down 15% from 2020 and down 30% from 2019.
Organic fruits from Ecuador in the U.S. market | Historical volumes (in Kg)
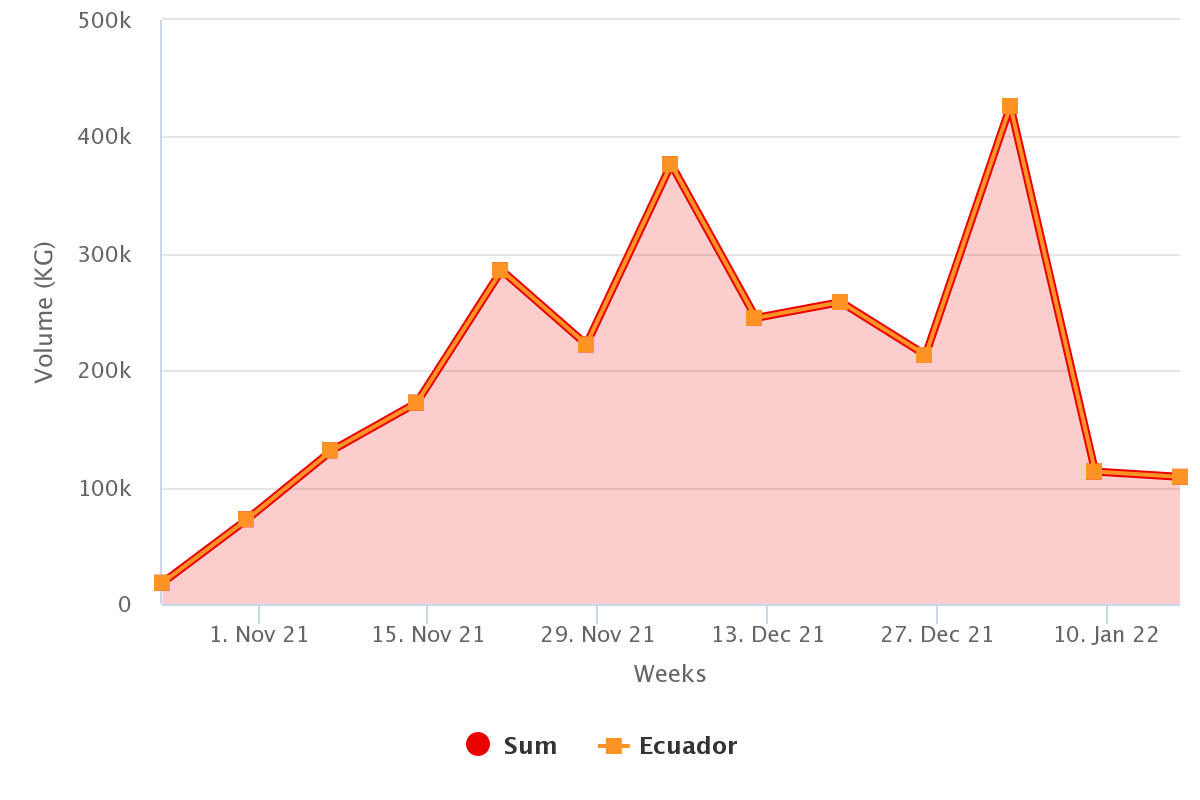
Source: USDA Market News via Agronometrics.
(Agronometrics users can view this chart with live updates here)
Chile is a significant supplier of organic blueberries and apples to the U.S.
Value of U.S. imports of Chilean produce for the December 2020 through November 2021 period were:
- Blueberries: $84.8 million, up 26% from 2020 and up 44% from 2019; and
- Apples: $21.1 million, up 4% from 2020 and down 36% from 2019.
Organic fruits from Chile in the U.S. market | Historical volumes (in Kg)
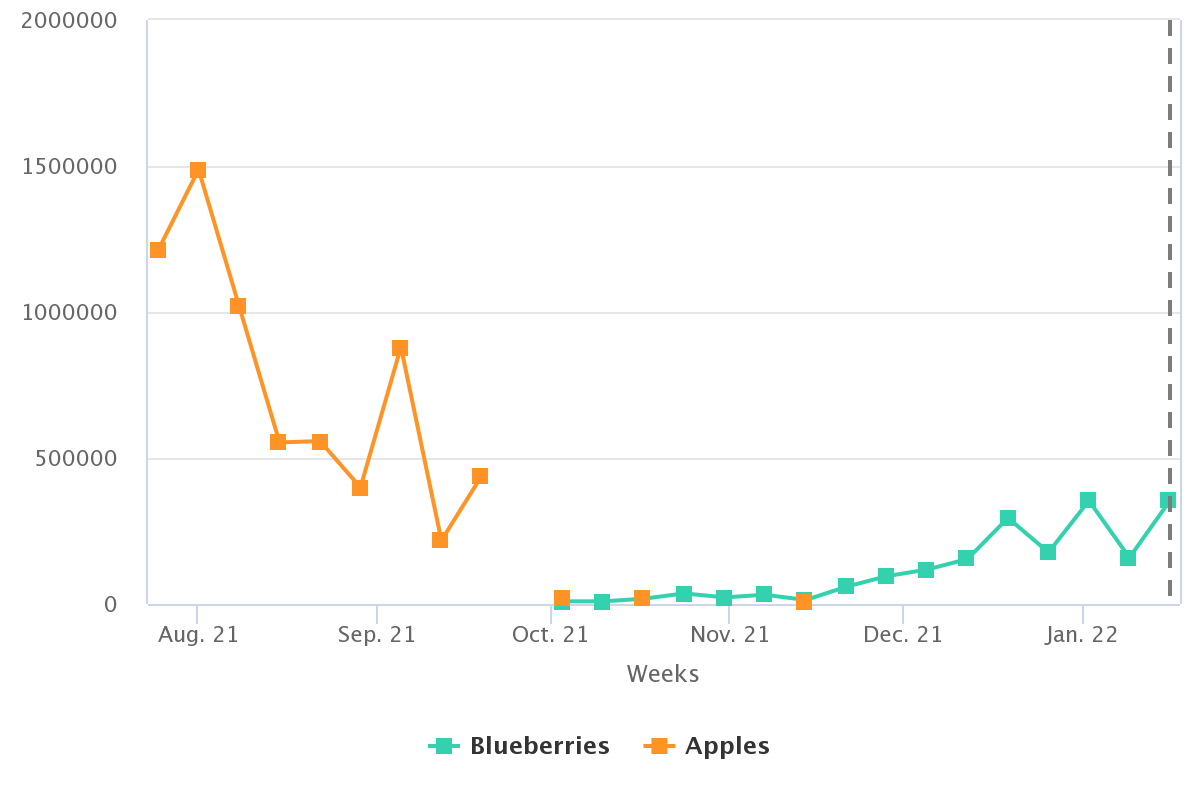
Source: USDA Market News via Agronometrics.
(Agronometrics users can view this chart with live updates here)
Imports of organic bananas to the U.S. from Colombia totaled $76.7 million in 2021, up 24% from 2020 and up 28% from 2019.
U.S. imports of organic pears from Argentina totaled $9.2 million in 2021, up 19% from 2020 and down 2% from 2019. U.S. imports of organic lemons from Argentina totaled $1 million in 2020, up 374% from 2020 and up 281% from 2019.
Organic lemons from Argentina in the U.S. market | Historical volumes (in Kg)
Source: USDA Market News via Agronometrics.
(Agronometrics users can view this chart with live updates here)
New Zealand organic apple shipments to the U.S. totaled $22.7 million in 2021, up 14% from 2020 and down 9% compared with 2019.
The News in Charts is a collection of stories from the industry complemented by charts from Agronometrics to help better tell their story.
Access the original article with this (Link)