
Pears in Charts: What will Washington’s season look like?
By
| 27 August 2019
The largest pear producer in the U.S. is Washington, the king state of pome fruit. The chart below illustrates what the season looks like, bringing to life the last 12 months of volumes and prices.
The Washington pear season runs from August to July in a classic distribution with relatively stable prices that dip as the season evolves. They range from $28.91 for a ⅘ bushel cartons in August to a low of $21.74 in April last year.
Washington Pears Non-Organic Prices and Volumes
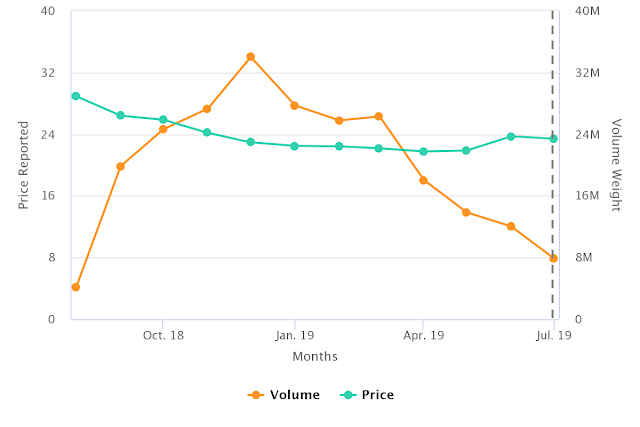
Source: USDA Market News via Agronometrics. (Agronometrics users can
view this chart with live updates here)
As we just begin to wrap up last season, we can see Washington’s growth has been impressive. Offering U.S. consumers an increase of 15%, or 31 million kilos, more fruit than they had sent the previous season.
Historic Washington Non-Organic Pear Volumes
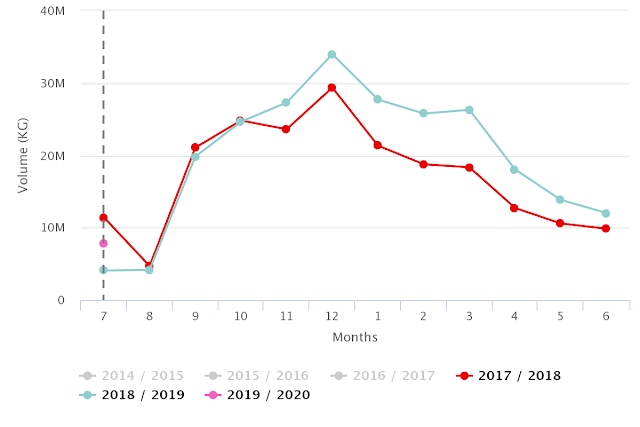
Source: USDA Market News via Agronometrics. (Agronometrics users can
view this chart with live updates here)
If we look at the difference in volume between the 2017-18 and 2018-19 seasons – especially after September, when Washington and Oregon dominate the market – we can see a relationship emerge that is very similar to what we saw in prices.
The laws of supply and demand being alive and well in pears, this way of looking at the data gives us an idea of why prices were lower than the previous season and offers a rough idea of what we might expect things to go in the upcoming season.
Historic Washington Non-Organic Pear Prices
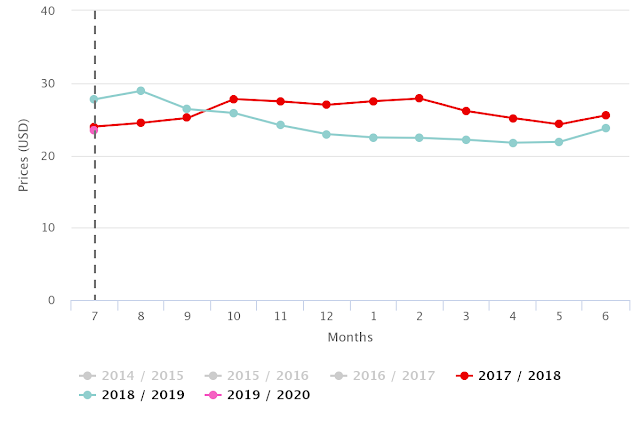
Source: USDA Market News via Agronometrics. (Agronometrics users can
view this chart with live updates here)
Favorable sizing has increased the volume forecast for pears out of the Northwest to similar levels as we saw last year (U.S.: Northwest pear crop forecasts rises amid large sizings). As such, it looks like we may see similar prices to last years as well.
This doesn’t mean that this season will be a mirror image of last year; there are other factors that this overview of the market data does not take into account. But the distribution of the volumes as the season progresses is very important. We are already seeing that California’s season is running two to three weeks late; and recently Washington has also dipped below last year, presumably also because of a delay.
If the volume forecasts are to hold true, this may mean that volumes are more concentrated. This could mean price movements at different times than we saw last year and possibly more volatility.
Written by: Colin Fain
Original published in FreshFruitPortal.com on August 27, 2019 (Link)


